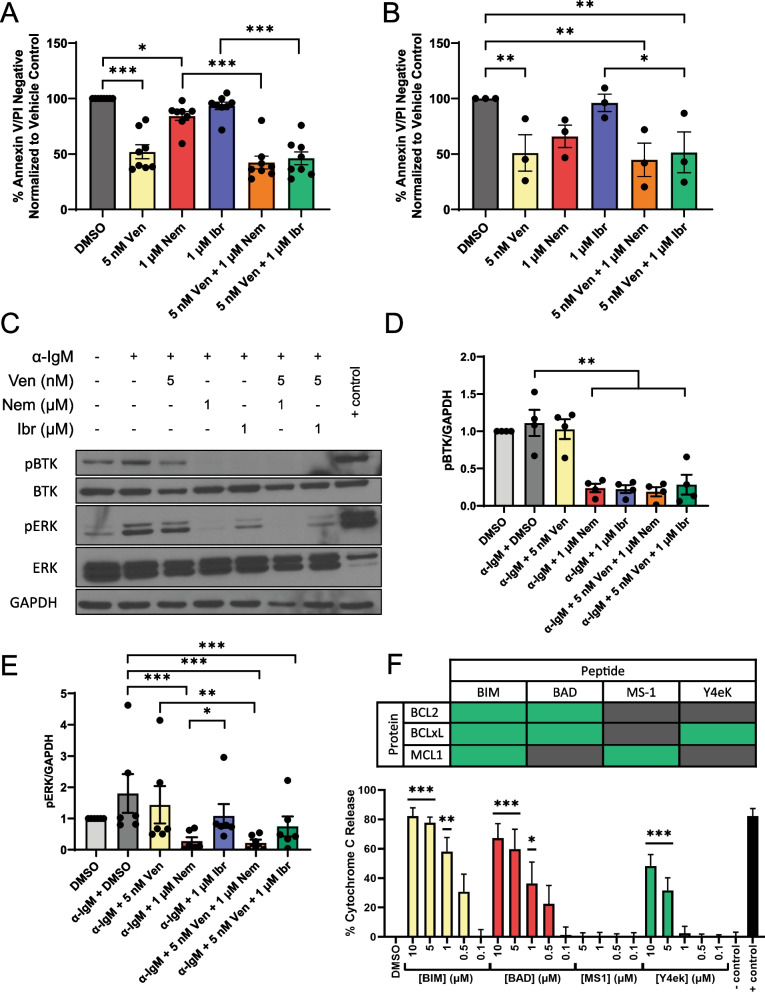
Fig. 1.
A Primary CLL cells were treated with DMSO, venetoclax (5 nM), nemtabrutinib (1 μM), ibrutinib (1 μM) or in combination. Ibrutinib was washed out after 1 h and total incubation time was 24 h. Cell viability was assessed by flow cytometry following Annexin V/PI staining. Data are normalized to DMSO control. A linear mixed effect model was used to analyze raw data and p values were adjusted for multiple comparisons using Tukey’s method (*p ≤ 0.05, **p ≤ 0.01, ***p ≤ 0.001). B Ibrutinib refractory CLL cells harboring C481S mutant BTK were treated with DMSO, venetoclax (5 nM), nemtabrutinib (1 μM), ibrutinib (1 μM) or in combination. Ibrutinib was washed out after 1 h and total incubation time was 24 h. Cell viability was assessed by flow cytometry following Annexin V/PI staining. Data are normalized to DMSO control. A linear mixed effect model was used to analyze raw data and p values were adjusted for multiple comparisons using Tukey’s method (*p ≤ 0.05, **p ≤ 0.01, ***p ≤ 0.001). C Representative immunoblot. Primary CLL cells were treated with DMSO, venetoclax (5 nM), nemtabrutinib (1 μM), ibrutinib (1 μM) or in combination. Ibrutinib was washed out after 1 h and total incubation time was 24 h. Cells were then stimulated with 10 µg plate-bound anti-IgM for the final 15 min of the total incubation time before collection of whole cell lysate and analysis using SDS-PAGE. D, E All immunoblots of primary CLL patient samples were quantified using densitometry software (AlphaView). Protein levels (D. pBTK, E. pERK,) normalized to GAPDH loading control are reported as fold change over vehicle control. A linear mixed effect model was used to analyze raw data normalized to GAPDH loading control and p values were adjusted for multiple comparisons using Tukey’s method (*p ≤ 0.05, **p ≤ 0.01, ***p ≤ 0.001). F Primary CLL cells from nemtabrutinib treated patients were co-cultured with NK Tert stromal cells (Riken, RCB2350) before performing BH3 profiling using BIM, BAD, MS-1, Y4ek, and PUMA2A peptides [8]. Baseline cytochrome c release measured in DMSO treated cells has been subtracted from all test conditions and controls presented. Cytochrome c release in response to interaction with BIM, BAD, and Y4ek peptides indicates cellular dependency on BCL2 and BCL-xL. A linear mixed effect model was used to analyze raw data and p values were adjusted for multiple comparisons using Tukey’s method. All statistics represented are in comparison to DMSO treated control (*p ≤ 0.05, **p ≤ 0.01, ***p ≤ 0.001). Peptide-protein interaction chart shows high interaction in green and low interaction in gray

