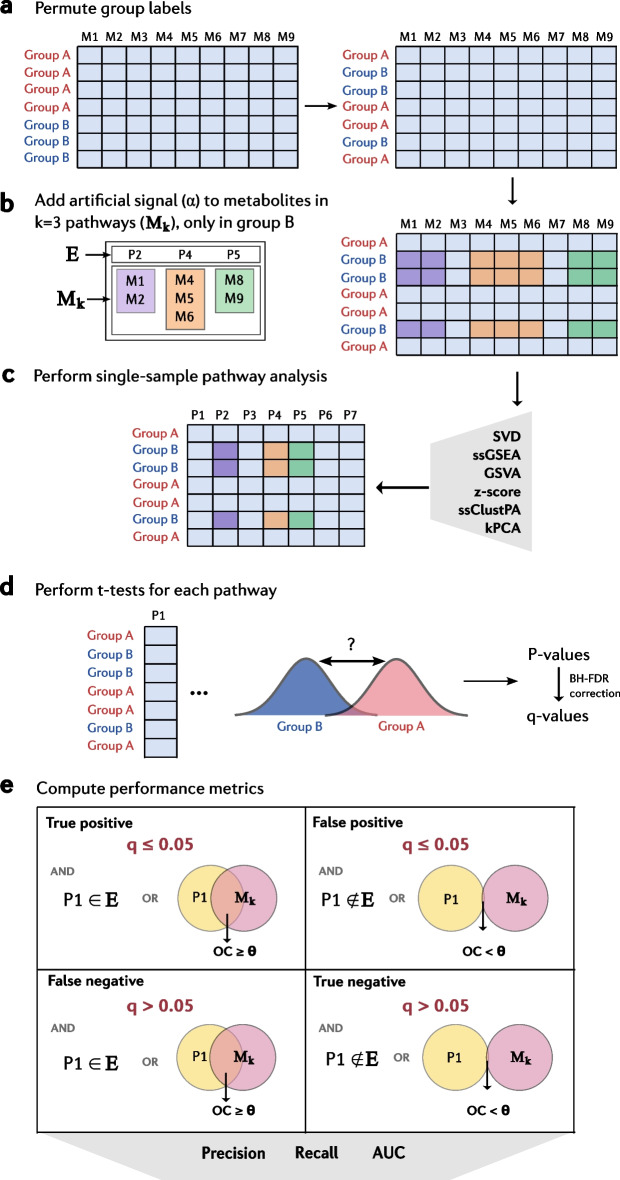
Fig. 2.
Schematic outlining the benchmarking process used in this work. a Sample group labels are randomly permuted. b An artificial signal is added (α) to all metabolites in Mk (set of all metabolites within the k = 3 randomly selected pathways (E)) only to samples in group B. c Single-sample pathway analysis is performed on the semi-synthetic data matrix generated in step b) using the various methods benchmarked. d Independent two-sample t-tests are performed for each pathway (p) analysed using ssPA, to provide p-values for the significance of the different in pathway score means between samples in group A and group B. e Benjamini–Hochberg adjusted q-values for each pathway p are used to compute performance metrics, taking account of the level of overlap between the pathway p and Mk, as well as whether p is a member of the set E (enriched pathways). Considering the q-value and overlap threshold, each pathway can be classed as a true positive, false positive, false negative, or true negative, and used to compute the performance metrics: precision, recall, and area under the curve (AUC)

