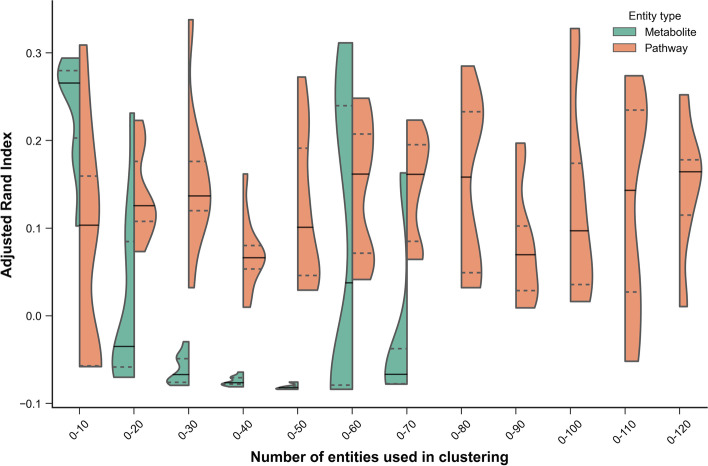
Fig. 8.
Clustering performance at the metabolite and pathway levels (kPCA method) for different selection thresholds. Clustering performance is quantified using the Adjusted Rand Index (y-axis). The number of entities used to perform the clustering are shown on the x-axis, and only entities significant at q 0.05 were included in the analysis. A total of 69 metabolites and 116 pathways were significant and are shown in the violin plots. Entities were ranked by q-value and only those within each selection threshold are used for each comparison. Violin plots show the distribution of ARI values achieved using the cumulative thresholds (e.g. the top 10 pathways). Solid lines represent the median ARI, whereas dashed lines represent the upper and lower quartiles. The violin plot range is truncated to the range of the data

