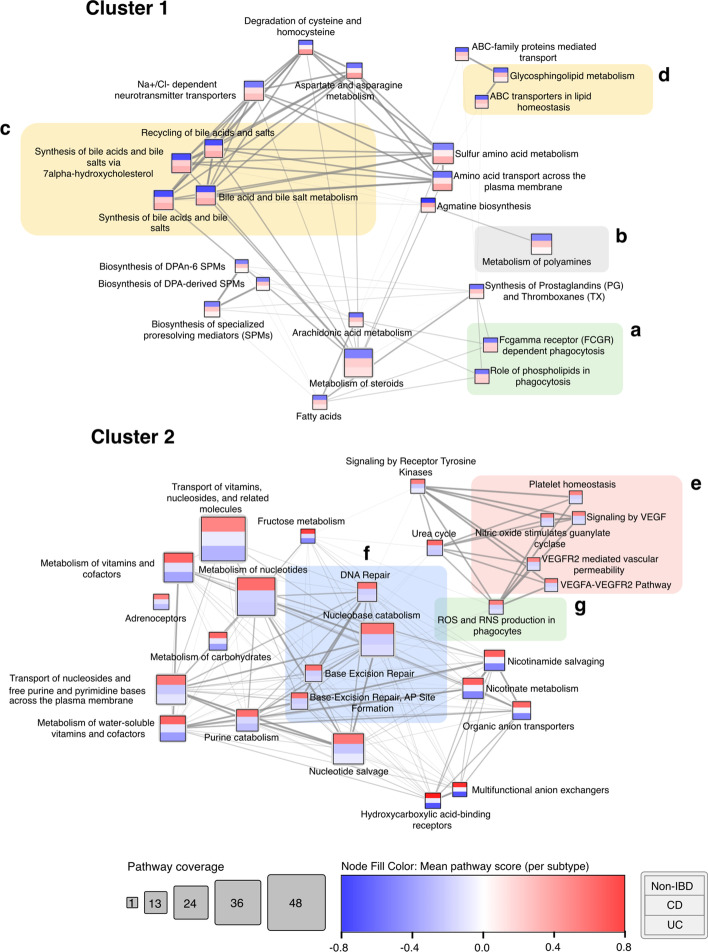
Fig. 9.
Pathway cluster network derived using hierarchical clustering on IBD pathway scores (kPCA, top 50 pathways). Coloured bands in each node represent mean pathway score within each subtype (from top to bottom: non-IBD, CD, UC). Edge weight represents Spearman correlation between pathway scores. Only edges with Spearman’s rank correlation coefficient () 0.4 are displayed. Shaded sub-clusters depict pathways consistent with current IBD literature and are discussed in the text. Shading of subclusters corresponds to Reactome pathway parent category

