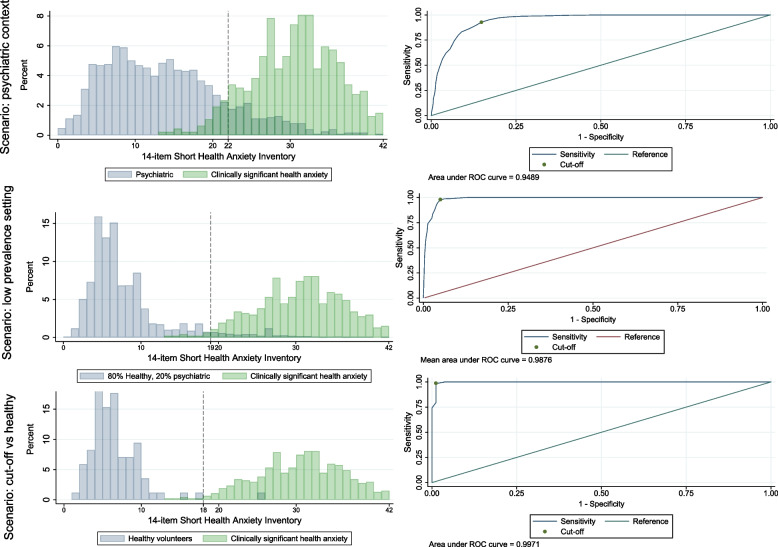
Fig. 1.
Receiver Operating Characteristic Curves and Distributions of Mean SHAI-14 Scores. Note. The figure demonstrates distribution of mean scores on the SHAI-14 in the three scenarios. The shaded part of the distributions shows the amount of overlap on mean scores on the SHAI-14 between the different samples. Clinically significant health anxiety refers to participants with either primary or secondary clinically significant health anxiety. ROC-curves for the whole range of cut-off points on the SHAI-14 in the three different scenarios are also presented and their respective AUC-values

