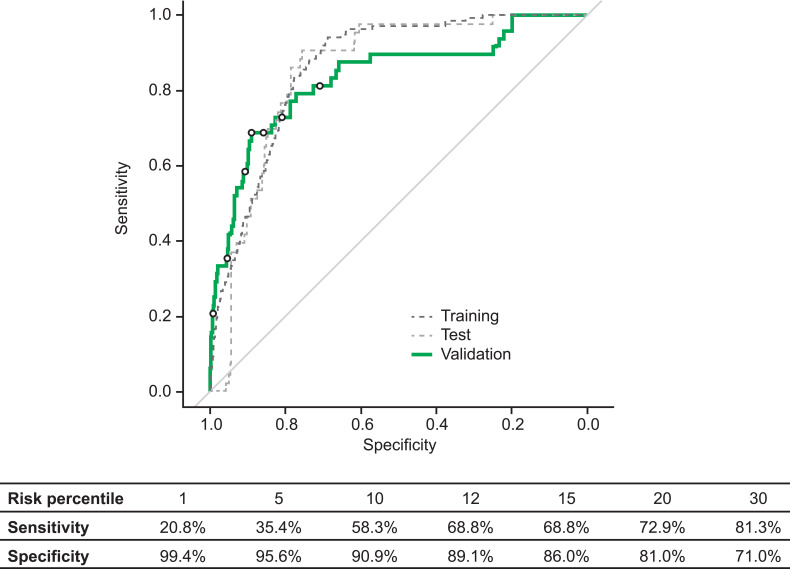
Figure 6.
Receiver operating characteristic curve of sensitivity and specificity of a model for predicting upcoming exacerbations within 5 days. Selected risk percentiles shown in table are based on model score, eg, the sensitivity and specificity values for risk percentile 1 are those for the 1% of data points with the highest predicted probability for an exacerbation within 5 days.

