Figure 5.
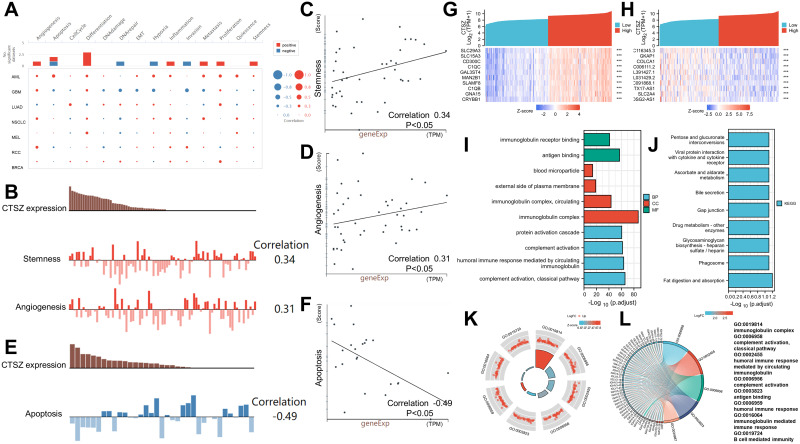
Functional states of CTSZ and enrichment analysis. (A) The functional states of CTSZ across nine types of cancer by CancerSEA. The red plots indicate that CTSZ was positively correlated with the functional states, while the blue plots indicate that CTSZ was negatively correlated with the functional states. (B) CTSZ expression level and the corresponding tumor stemness score and tumor angiogenesis score of each patient with ccRCC. (C) Scatterplots of correlations between CTSZ expression and stemness of ccRCC. (D) Scatterplots of correlations between CTSZ expression and angiogenesis of ccRCC. (E) CTSZ expression level and the corresponding tumor angiogenesis score of each patient with ccRCC. (F) Scatterplots of correlations between CTSZ expression and apoptosis of ccRCC. The top 10 positively (G) and negatively (H) related genes. GO analysis (I) and KEGG pathway enrichment analysis (J) of CTSZ coexpressed genes. Immune-related results of GO enrichment analysis were visualized in chord (K) and GOCircle plots (L). ***P < 0.001.

