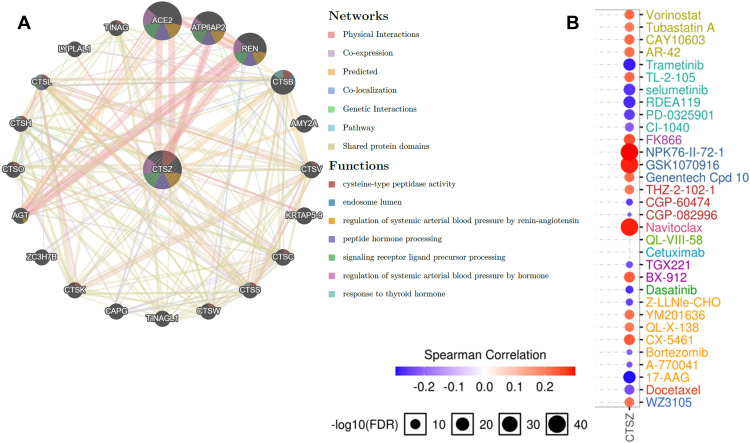
Figure 7.
Protein–protein interaction (PPI) network and drug sensitivity analysis of CTSZ. (A) PPI network and functional analysis of CTSZ and its neighboring genes. Different colors of the network edge indicate the bioinformatics methods applied: physical interaction, coexpression, website prediction, colocalization, pathway and genetic interactions, and shared protein domains. The different colors of network nodes indicate the enrichment results of the gene set. The size of each circle represents the rank of gene that correlated with CTSZ. The width of each line represents the weight of the corresponding individual data source in the composite network. (B) Correlation between CTSZ expression and small molecule/drug sensitivity (IC50) based on the GDSC database.
Abbreviations: IC50, half-inhibitory concentration; GDSC, Genomics of drug Sensitivity in Cancer.

