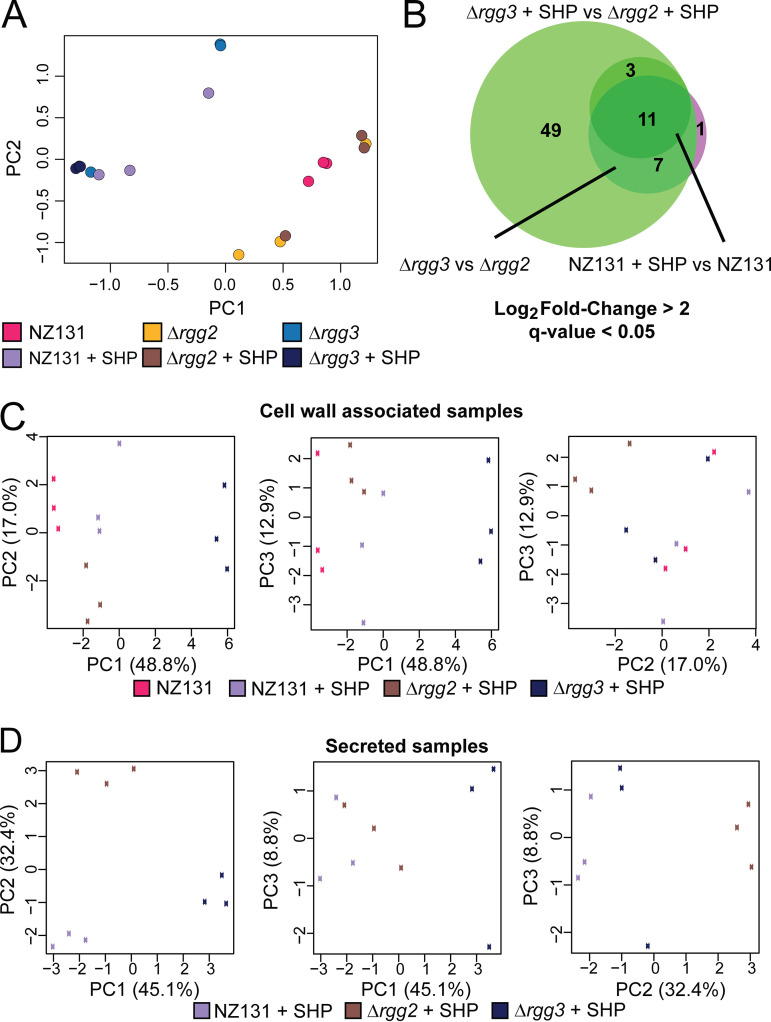
FIG 4.
PCA analysis of RNA-seq and proteomics results, and additional RNA-seq data. For a complete list of differentially expressed transcripts and proteins, see Supplemental Files 1 to 3. (A) Principle component analysis of RNA-seq results. The legend below the graph indicates the color of each sample, for which three biological replicates were harvested. (B) Venn diagram of RNA-seq results, demonstrating a core regulon of 11 genes for the Rgg2/3 system. NZ131 + SHP versus NZ131 is indicated by the darker green circle, Δrgg3 versus Δrgg2 by the pink-purple circle, and Δrgg3 + SHP versus Δrgg2 + SHP by the light green circle. Log2 fold change greater than 2 and q-value of less than 0.05 was used as a cutoff for significance. Eleven genes are found to be differentially regulated under all conditions. (C) Three-way principal-component analysis of cell wall associated samples proteomics results. The legend below the graphs indicates the corresponding sample with the box color on each graph. (D) Three-way principal-component analysis of secreted samples proteomics results. The legend below the graphs indicates the corresponding sample with the box color on each graph.

