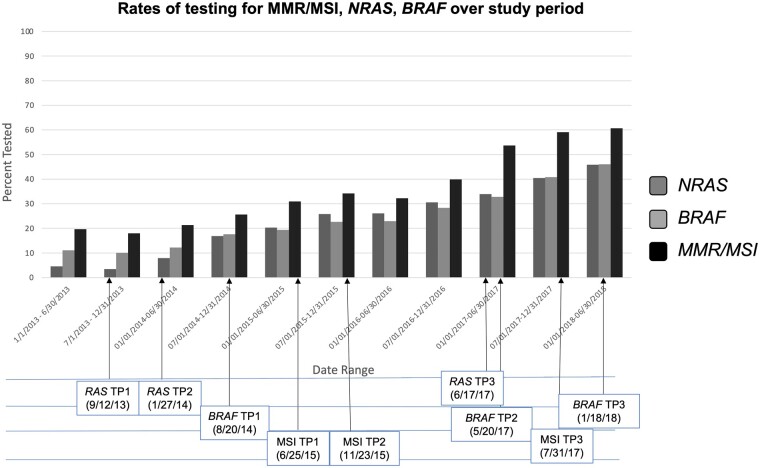
Figure 2.
Rates of testing RAS,BRAF, and MMR/MSI testing over time. Changes in rates of biomarker testing are depicted in this figure for RAS, BRAF, and MSI with arrows depicting the relevant time point during the analysis (refer to Figure 1 for time point description). MMR = mismatch repair; MSI = microsatellite instability; TP = time point.

