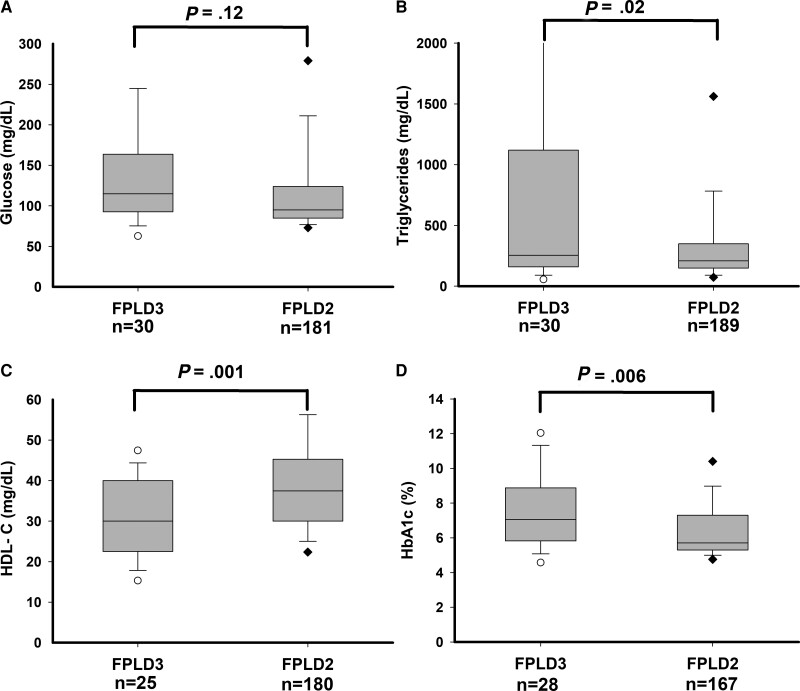
Figure 1.
Fasting serum glucose, triglycerides, HDL cholesterol, and HbA1c levels in subjects with FPLD3 and FPLD2. (A) Fasting serum glucose, (B) fasting serum triglycerides, (C) HDL-cholesterol, and (D) blood hemoglobin A1c. Numbers of subjects for whom the value of the variable was available are shown below the x-axis. The gray box shows 25th and 75th percentile values with median shown as a horizontal line. The whiskers denote 5th and 95th percentiles. Individual values below the 5th and above the 95th percentile are shown. The 95th percentile of serum triglycerides (5577 mg/dL) for subjects with FPLD3 is not shown. Serum triglycerides exceeding 2000 mg/dL were seen in 5 subjects with FPLD3 (2104, 3115, 4127, 5577, and 7919 mg/dL) and 5 subjects with FPLD2 (2160, 2285, 7740, 9040, and 11 528 mg/dL), which are not shown in the figure. P values are shown above the box plots.

