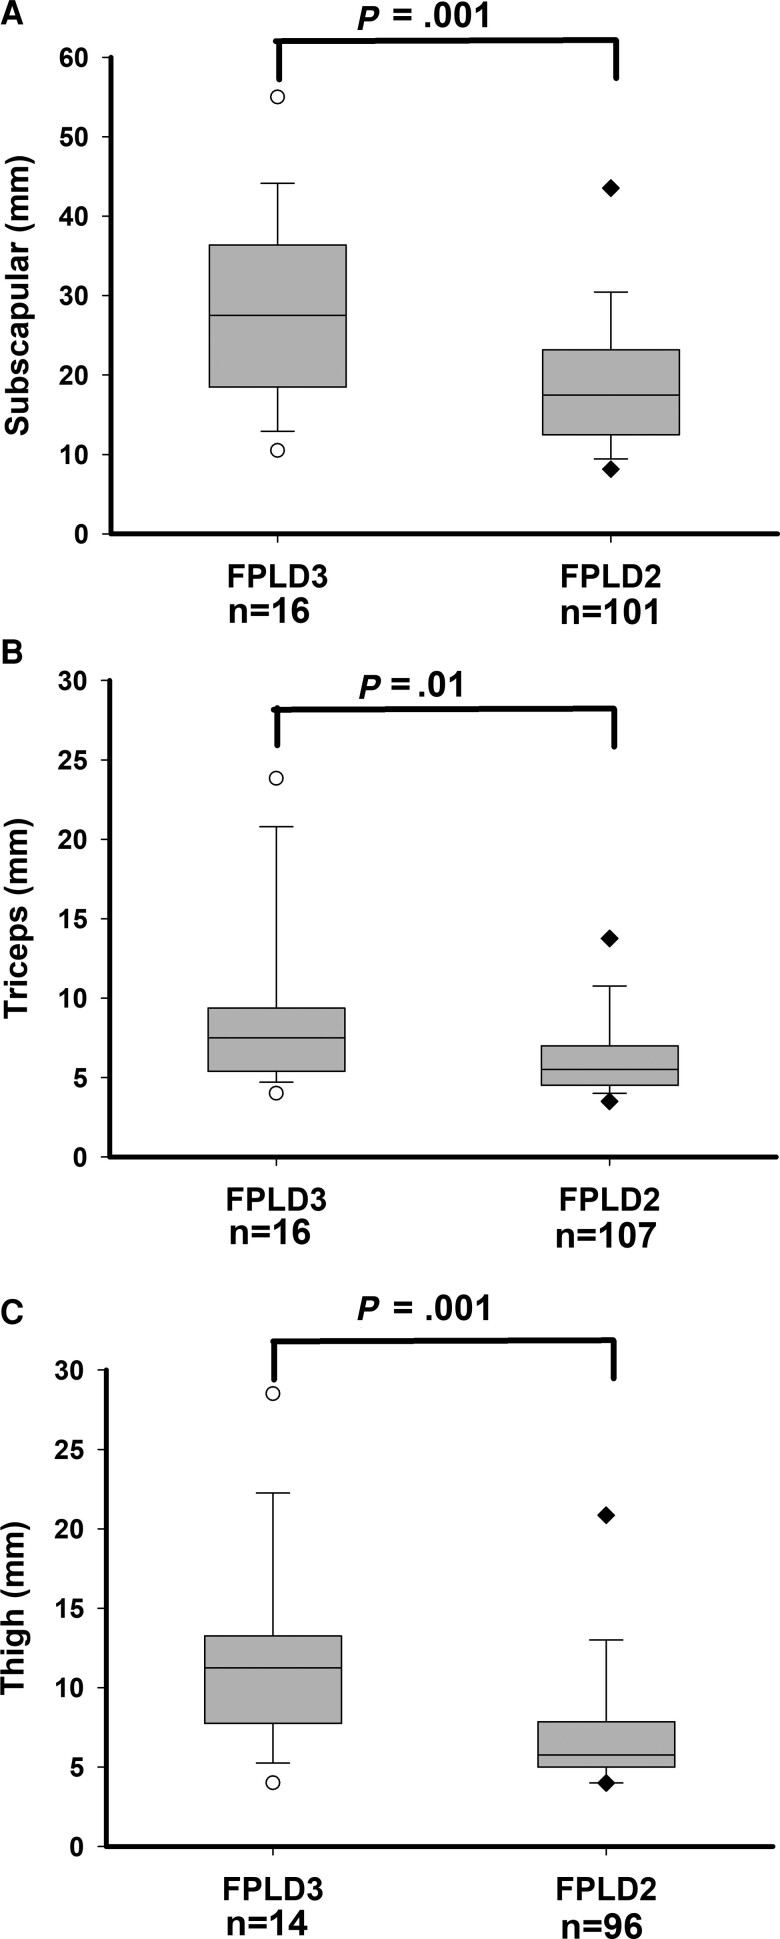
Figure 2.
Skinfold thickness measurements in subjects with FPLD3 and subjects with FPLD2. (A) Subscapular skinfold thickness (mm) measurements, (B) triceps skinfold thickness (mm) measurements, and (C) thigh skinfold thickness (mm) measurements. Numbers of subjects for whom the value of the variable was available are shown below the x-axis. The gray box shows 25th and 75th percentiles with median shown as a horizontal line. The whiskers denote 5th and 95th percentiles. Individual values below the 5th and above the 95th percentile are shown. P values are shown above the box plots.

