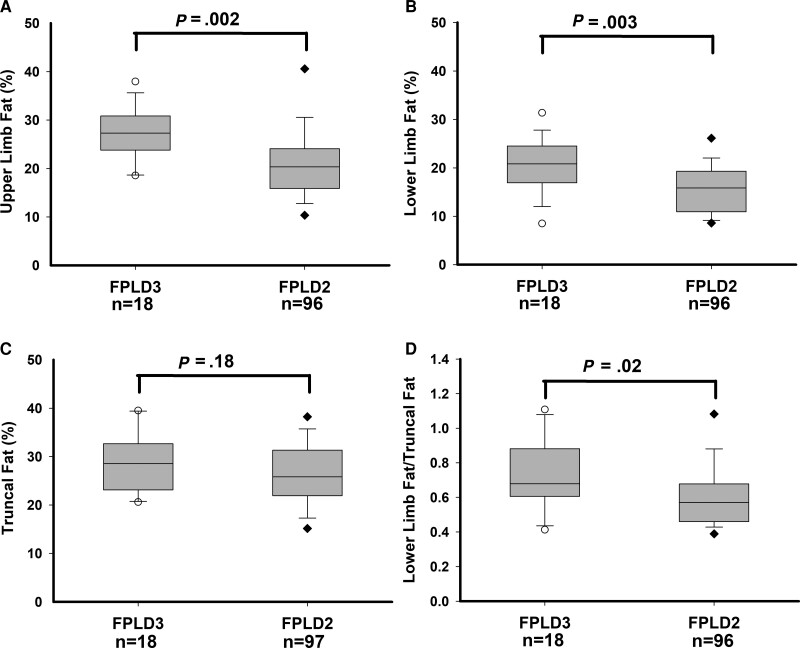
Figure 3.
Regional body fat (% of fat mass/total regional mass) measurements by DXA scan in subjects with FPLD3 and FPLD2. (A) Upper limb fat (%) measurements, (B) lower limb fat (%) measurements, (C) truncal fat (%) measurements, and (D) ratio of lower limb fat/truncal fat. Numbers of subjects for whom the value of the variable was available are shown below the x-axis. The gray box shows 25th and 75th percentiles with median shown as a horizontal line. The whiskers denote 5th and 95th percentiles. Individual values below the 5th and above the 95th percentile are shown. P values are shown above the box plots.

