Figure 3.
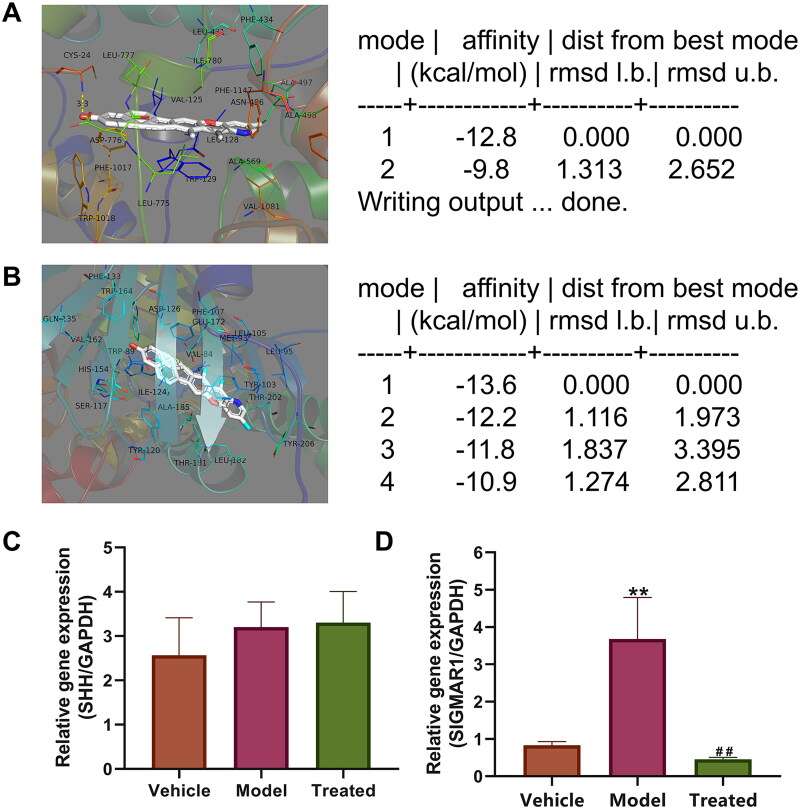
Bioinformatics screening of veratramine target proteins. (A) Veratramine was visualised by docking with SHH protein, and its docking binding energy was –12.8 kcal/mol; (B) Veratramine was visualised by docking with SIGMAR1 protein, and its docking binding energy was –13.6 kcal/mol; (C) qPCR was used to detect SHH gene expression levels in the spinal cord tissues of rats in each group; (D) The spinal cord tissues of rats in each group were examined for SIGMAR1 gene expression levels by qPCR. **p < 0.01, vs. vehicle group, ##p < 0.01, vs. model group.

