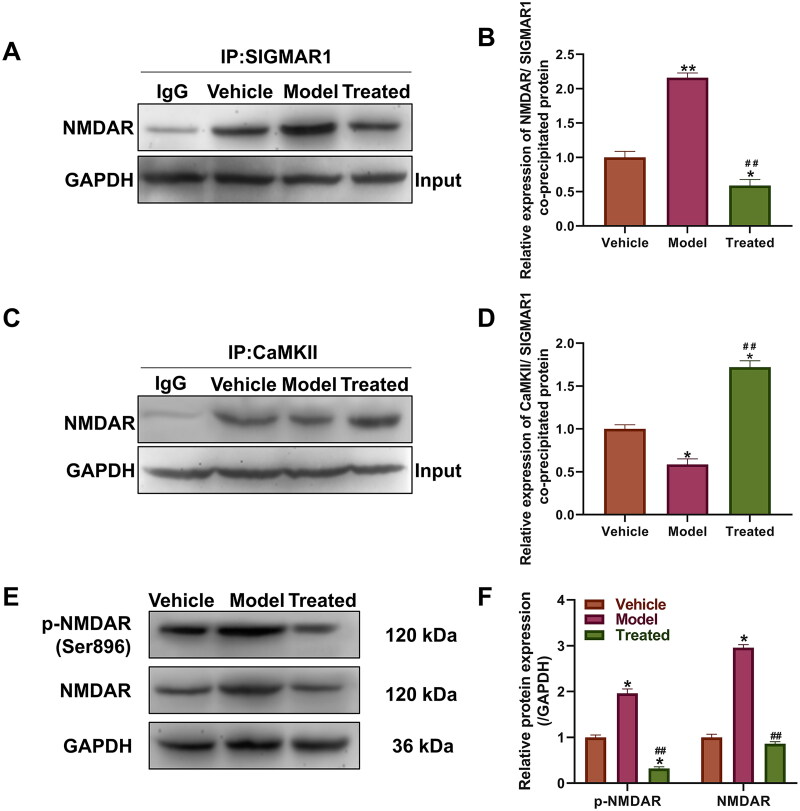
Figure 5.
Effect of veratramine on SIGMAR1 and its downstream regulatory proteins. (A) Coimmunoprecipitation (Co-IP) results of SIGMAR1 with NMDAR protein. (B) Statistical quantification map of band grey values in result A; (C) Co-IP results of CaMKII with NMDAR protein. (D) Statistical quantification map of band grey values in results C; (E) WB was used to detect the expression levels of NMDAR and its phosphorylated proteins. (F) Statistical quantification plot of grey values of WB bands. **p < 0.01, *p < 0.01, vs. vehicle group; ##p < 0.01, vs. model group.

