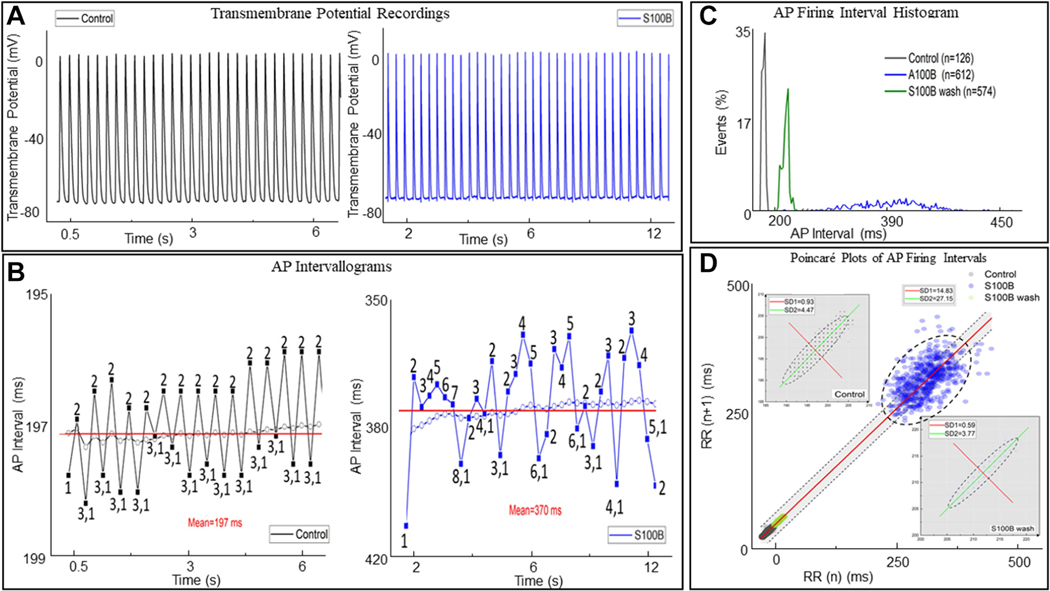
FIGURE 15. Intracellular Microelectrode Recording From a Representative Right Atrial Cell.
(A) Excerpt of the intracellular recording in control conditions (black) and in the presence of 200 nM S100 calcium-binding protein B–positive (S100B) (blue). (B) Variability in inter-action potential (AP) cycle lengths and the mean inter-AP cycle length for all APs occurring in the time series in control and in the presence of S100B. In both, the dotted line indicates the mean interval, and a running average for the time series is shown. (C) A histogram of the distribution of AP firing interval under control conditions, in the presence of 200 nM S100B, and after 40 minutes of washout. (D) Poincaré analysis of the time series, with the insets displaying a magnified version of the Poincaré plots for control and washout conditions. The best fit line of all the points is given by the equation y = 1.0x + 1.63, R2 = 1.0, indicating the self-similarity among the points in the time series, although their absolute magnitudes differ.

