
Figure 4.
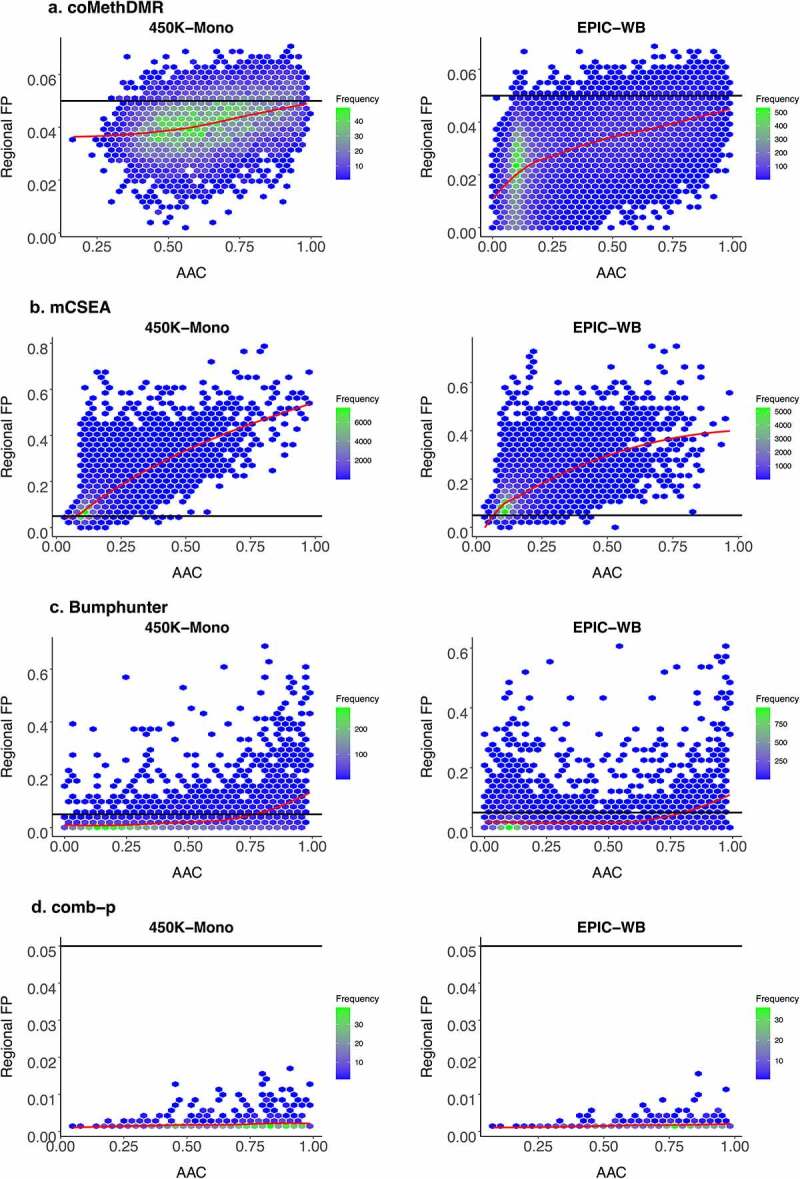
Regional False Positive Rates vs Average Absolute Pairwise Correlations on 450 K-Mono and EPIC-WB for the Normal Phenotype with Overall Trend Indicated by a Loess Curve in Red: A. coMethDMR, B. mCSEA, C. Bumphunter, D. comb-p.
*Regional FP: regional false positive rate. *AAC: average absolute pairwise correlation. *450 K-Mono: 450 K monocytes data; EPIC-WB: EPIC whole blood data.