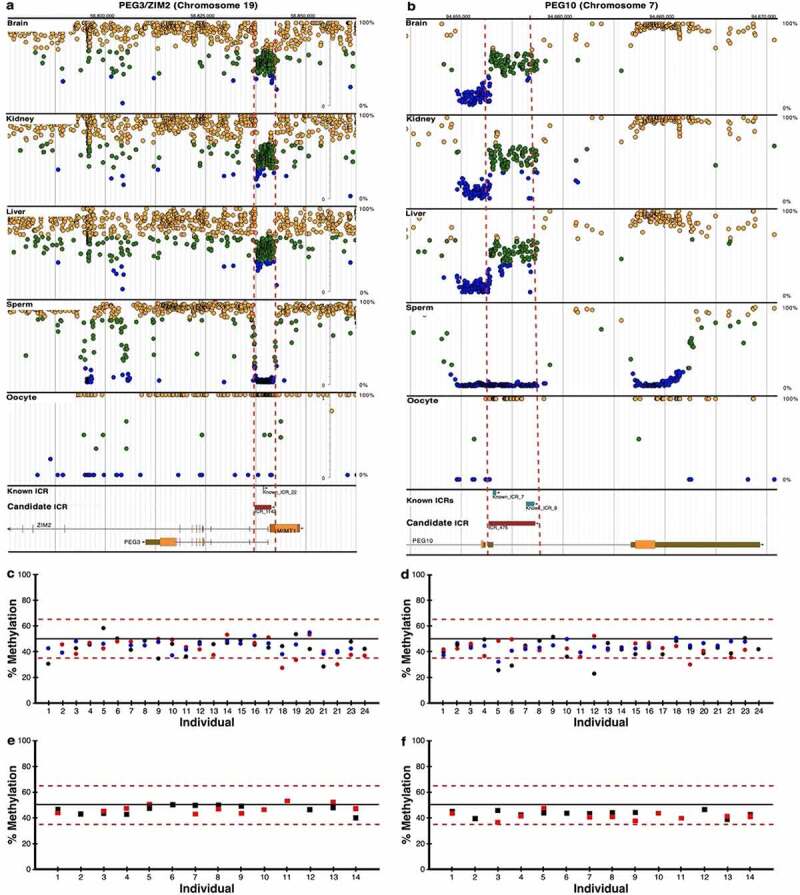
Figure 3.

Pyrosequencing results for previously known ICRs. DNA methylation profiles determined by whole genome bisulphite sequencing (WGBS) are shown for imprinted genes (a) PEG3/ZIM2 (ICR_1142) and (b) PEG10 (ICR_475) with previously known (blue boxes) and candidate ICRs (red boxes); visualize at https://humanicr.org/. DNA methylation levels determined by WGBS in sperm and oocytes are also provided. These sequence data were supplemented with publicly available gametic sequence (accession number JGAS00000000006) and part of control sperm data from PRJNA754049 [25,26]. Dots indicate hemi-methylation (green), hypomethylation (blue) and hypermethylation (yellow) based on (WGBS). The vertical dashed red lines delineate the candidate ICR regions. Confirmation of 50 ± 15% DNA methylation of the ICRs determined by WGBS is shown for (c) PEG3/ZIM2 and (d) PEG10 using pyrosequencing of kidney (black circles), liver (red circles), and brain (blue circles) tissues from 24 embryos. Confirmation of 50 ± 15% DNA methylation determined by WGBS is shown for (e) PEG3/ZIM2 and (f) PEG10 using pyrosequencing for CD14 monocytes (red squares) and HUVECs (black squares) from 14 adult individuals.
