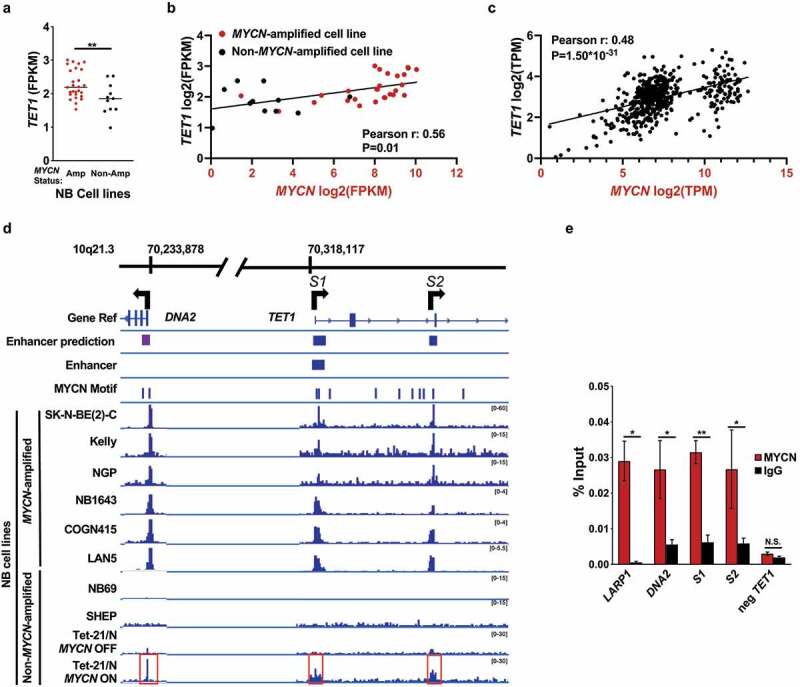
Figure 1.

MYCN binds a superenhancer located in the first intron of TET1 (S1), the second intron of TET1 (S2), and a predicted upstream enhancer site near DNA2. (a) TET1 expression data (FPKM) from RNA-seq of 38 NB cell lines [38] graphed according to MYCN-amplified (Amp, red) or non-amplified (Non-Amp, black) status. GEO accession numbers are given in Accession Numbers. (b) TET1 (y-axis) and MYCN (x-axis) expression data from RNA-seq of 38 NB cell lines [38] are expressed as log2 of FPKM. MYCN-amplified cell lines are denoted by red circles, and non-MYCN-amplified lines are denoted by black circles. r represents Pearson correlation coefficient, and P-values have been corrected with the Bonferroni correction method [67]. Cell line names and expression values can be found in Table S2. (c) TET1 (y-axis) and MYCN (x-axis) expression data from RNA-seq of 579 NB tumours [37]. TET1 vs MYCN expression data are plotted as log2 of FPKM. r represents Pearson correlation coefficient, and P-values have been corrected with the Bonferroni correction method [67]. (d) Enhancer regions, MYCN binding motifs, and MYCN ChIP-sequencing data visualized around the TET1 gene. The genomic loci on chromosome 10q21.3 are located at the top according to the hg19 genome build. The Gene Ref track shows the positions of the TET1 and DNA2 genes, and arrows show the directions of gene transcription. S1 and S2 are also indicated. Next, enhancers predicted by ‘EnhancerAtlas.org’ [42] are shown as purple rectangles. An enhancer within TET1 generated from the UCSC LiftOver tool [41] is shown as a purple rectangle. Below, the ‘MYCN Motif’ track, generated with HOMER [41], shows the positions of MYCN binding motifs as vertical bars. The bottom rows display MYCN ChIP sequencing data from SK-N-BE [2]-C, Kelly, NGP, NB1643, COGN415, LAN5, NB69, SHEP, and Tet-21/N cells [39,46] at locus 10q21 visualized with the count function of IGVtools [27]. The scale for each track is listed on the right in brackets. The shaded region corresponding to the first peak, from left to right, is within DNA2. The second shaded peak contains S1, within TET1-intron 1, and the last shaded peak contains S2, within TET1-intron 2. (e) Real time qPCR validation of MYCN ChIP-sequencing performed in SK-N-BE [2]. From left to right, positive control (LARP1), DNA2, S1, S2, and negative control (neg TET1) binding sites are plotted on the x-axis. MYCN pulldown values are plotted in red, and IgG controls are plotted in black. The y-axis corresponds to the amount of DNA pulled down normalized to the amount of input DNA. * and ** represent P < 0.05 and P < 0.01, respectively.
