Figure 4.

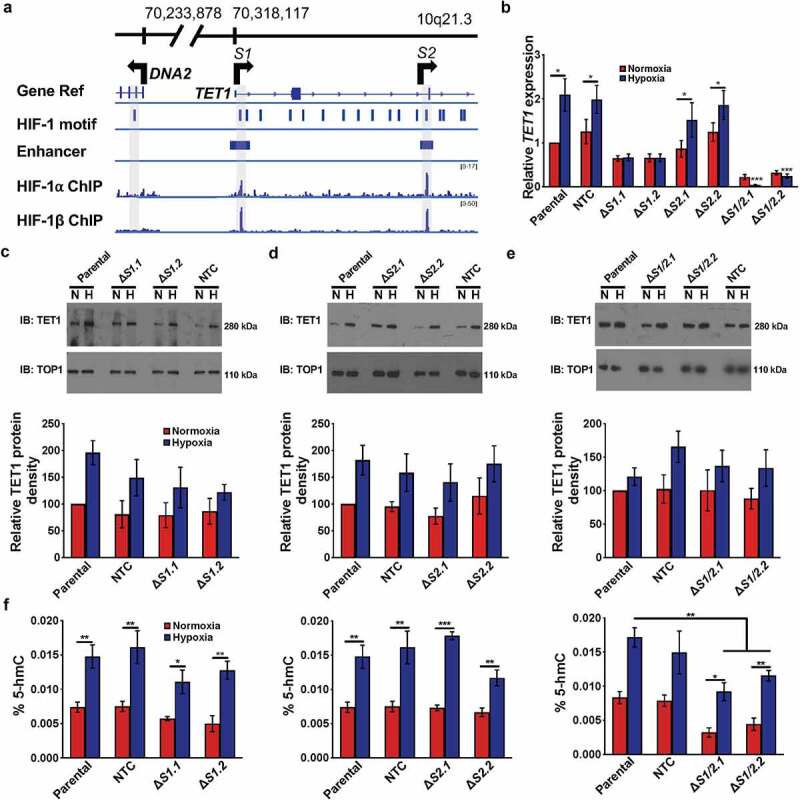
Hypoxia affects TET1 mRNA transcription and protein levels. (a) HIF-1 motif and sequencing data aligned with the TET1 promoter, transcriptional start site, and 5’ end of the gene. Top, genomic positions from hg19 at 10q21.3. Gene Ref track indicates locations of the TET1 and DNA2 genes, with arrows representing the direction of transcription of each gene. S1 and S2 are also indicated via shading. HIF-1 motifs are indicated by vertical lines and were identified by HOMER [41]. Next, an enhancer track marks the location of the enhancers found within TET1. HIF-1a and HIF-1b [51] ChIP-seq data from SK-N-BE [2] cells were visualized with IGVtools [27]. The scale for each track is listed on the right in brackets. (b) Real time qPCR quantification of TET1 transcription in normoxia (red) versus hypoxia (dark blue) across ΔS1, ΔS2, and ΔS1/2 clones, normalized to normoxic parental SK-N-BE [2] TET1 expression. P-values were determined with one-tailed t-tests between the parental cell line and the cell line of interest (n = 3). * represents P < 0.05. (c) Representative Western blots for TET1 protein (upper panels) in ΔS1 SK-N-BE [2] cells in normoxia (n) versus hypoxia (h), cropped at ~280 kDa. TOP1 loading control (lower panels), cropped at ~110 kDa. Bottom, mean TET1 protein quantified by ImageJ and normalized to parental normoxic controls in ΔS1 SK-N-BE [2] cells (n = 3). (d) Representative Western blots for TET1 protein (upper panels) in ΔS2 SK-N-BE [2] cells in normoxia (N) versus hypoxia (H), cropped at ~280 kDa. TOP1 loading control (lower panels), cropped at ~110 kDa. Bottom, mean TET1 protein quantified by ImageJ and normalized to parental normoxic controls in ΔS2 SK-N-BE [2] cells (n = 3). (e) Representative Western blots for TET1 protein (upper panels) in ΔS1/2 SK-N-BE [2] cells in normoxia (N) versus hypoxia (H), cropped at ~280 kDa. TOP1 loading control (lower panels), cropped at ~110 kDa. Bottom, mean TET1 protein quantified by ImageJ and normalized to parental normoxic controls in ΔS1/2 SK-N-BE [2] cells (n = 3). (f) Percent 5-hmC levels in Parental, non-targeted control (NTC), ΔS1, ΔS2, and ΔS1/2 CRISPR-edited SK-N-BE [2] cells grown in normoxia (red) versus hypoxia (dark blue). *, **, and *** represent P < 0.05, P < 0.01, and P < 0.001, respectively.
