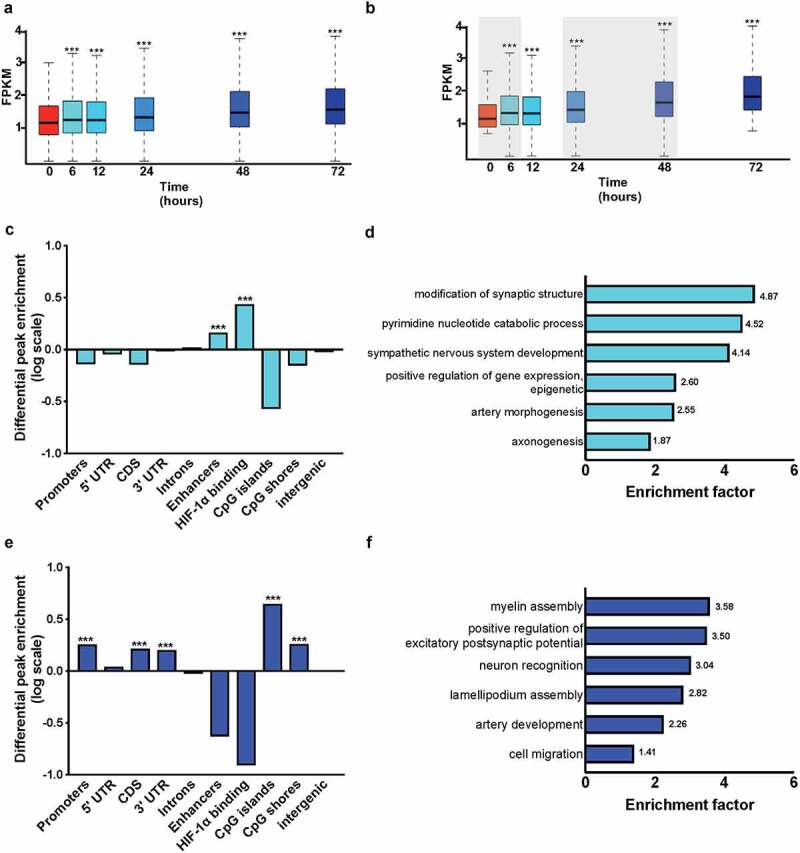
Figure 6.

Accumulation of 5-hmC in hypoxic SK-N-BE [2] NB cells occurs in genes important for neuronal morphology, hypoxia adaptation, and cell migration. (a) FPKM values of all 5-hmC peaks (n = 415,416) plotted versus time in hypoxic culture: 0, 6, 12 24, 48, and 72 hours. *** represents P < 2.2*10−16. (b) 5-hmC peaks (n = 189,949) that show a positive log fold change from 0 to 72 hours. Shaded regions indicate high fold-change between two timepoints. *** represents P < 2.2*10−16. (c) Log2 enrichment (y-axis) of peaks (n = 26,061) that increase from 0 to 6 hours plotted by genomic element (x-axis): promoters, 5’ untranslated regions (5’ UTR), coding domain sequences (CDS), 3’ untranslated regions (3’ UTR), introns, enhancers, HIF-1a binding regions (generated from our HIF-1a ChIP-sequencing data), CpG islands, CpG shores, and intergenic regions. *** represents P < 2.2*10−16. (d) Biological processes associated with the genes associated with the 5-hmC-enriched enhancers identified in (C) determined with PANTHER statistical overrepresentation test [32,68]. The biological process is shown on the y-axis, and the enrichment factor is plotted on the x-axis. The number at the right of each process gives the enrichment factor. (e) Log2 enrichment (y-axis) of peaks (n = 56,190) that increase from 0 to 6 hours plotted by genomic element (x-axis): promoters, 5’ untranslated regions (5’ UTR), coding domain sequences (CDS), 3’ untranslated regions (3’ UTR), introns, enhancers, HIF-1a binding regions (generated from our HIF-1a ChIP-sequencing data), CpG islands, CpG shores, and intergenic regions. *** represents P < 2.2*10−16. (f) Biological processes associated with 5-hmC-enriched CDS identified in (E) determined with PANTHER statistical overrepresentation test [32,68]. The biological process is shown on the y-axis, and the enrichment factor is plotted on the x-axis. The number at the right of each process gives the enrichment factor.
