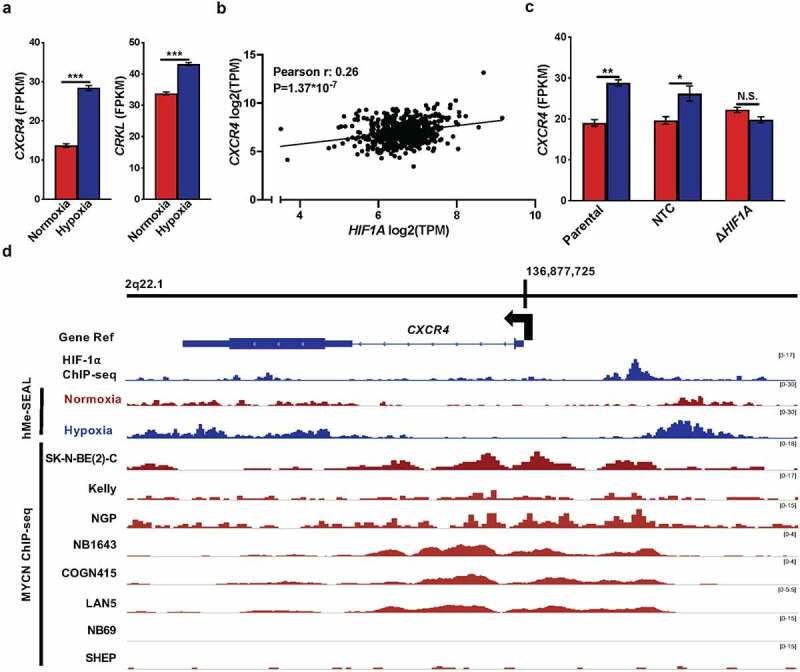
Figure 7.

MYCN and HIF-1 likely bind at the CXCR4 gene. (a) CXCR4 (left) and CRKL (right) expression plotted as FPKM (y-axis) analysed from RNA-seq data from SK-N-BE [2] cells grown under normoxia (red, x-axis) versus hypoxia (dark blue, x-axis). (b) CXCR4 versus HIF1A expression data plotted on the y- and x- axis respectively. r represents Pearson correlation coefficient, and P-values have been corrected with the Bonferroni correction method [67]. (c) CXCR4 RNA-seq expression data plotted as FPKM (y-axis) from Parental, non-targeted control (NTC), and ΔHIF1A SK-N-BE [2] cells (x-axis). Red, normoxia; dark blue, hypoxia. * and ** represent P < 0.05 and P < 0.01, respectively; N.S., not significant. (d) Aligned reads along the CXCR4 gene at locus 2q22.1 visualized with IGVtools [27]. Top track, the Gene Ref track of the CXCR4 gene. Next, HIF-1α ChIP-seq data from SK-N-BE [2] cells at 48 hours hypoxia; followed by tracks presenting the hMe-SEAL data obtained at 0 and 48 hours in hypoxia. The bottom eight tracks display MYCN ChIP-seq data from normoxic NB cell lines: SK-N-BE [2]-C, Kelly, NGP, NB1643, COGN415, LAN5, NB69, and SHEP [39,46]. The scale for each track is listed on the right in brackets.
