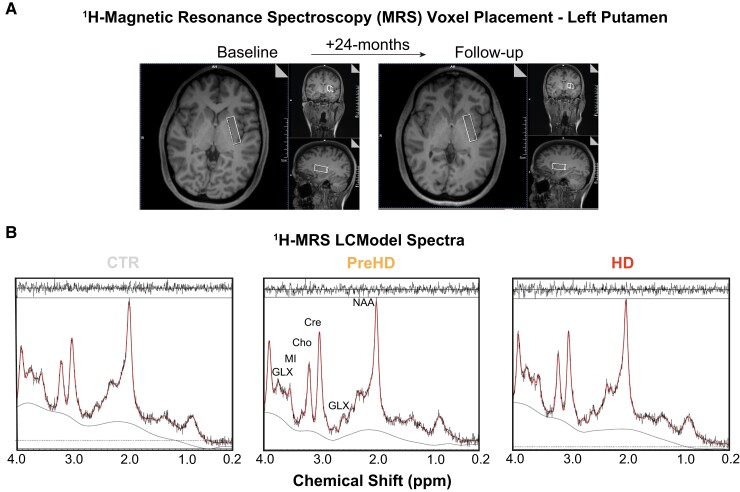
Figure 1.
1H-MRS voxel placement and LCModel spectra: (A) Example voxel placement in left putamen displayed at baseline and follow-up. For the voxel placement in the second 1H-MRS acquisition, the images from the first scanning were used to match the anatomical location. (B) LCModel output generated from healthy controls (CTR), premanifest (PreHD) and manifest (HD) gene expansion carriers, with black and red lines representing the raw spectrum and model fit overlaid on raw data, respectively. Output peaks represent specific metabolite concentrations. Several metabolites have been labelled on the PreHD spectra for illustrative purposes. ppm, parts per million.

