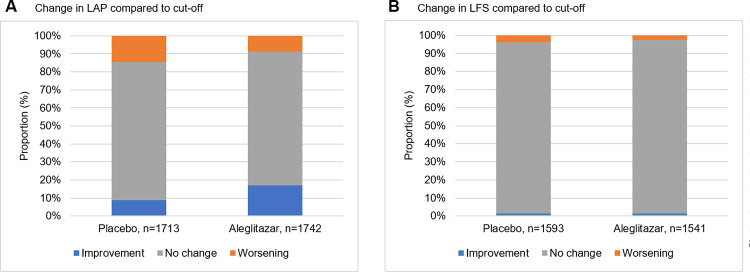
Fig 4. Change in LFS and LAP compared to cut-off values at baseline until 24 months follow-up.
Proportion of randomized patients that either improved (lnLAP below cut-off <4 for males and <4.4 for females, LFS below cut-of <-0.640), worsened (lnLAP above cut-off >4 for males and >4.4 for females, LFS above cut-off >-0.064), or did not change in respect to respective cut-off value. Proportion of change is significantly different between treatment and placebo for LAP (A), both improvement and worsening P<0.001. For LFS (B) only worsening is significantly less in the treatment group, improvement P = 0.974, worsening P = 0.031.

