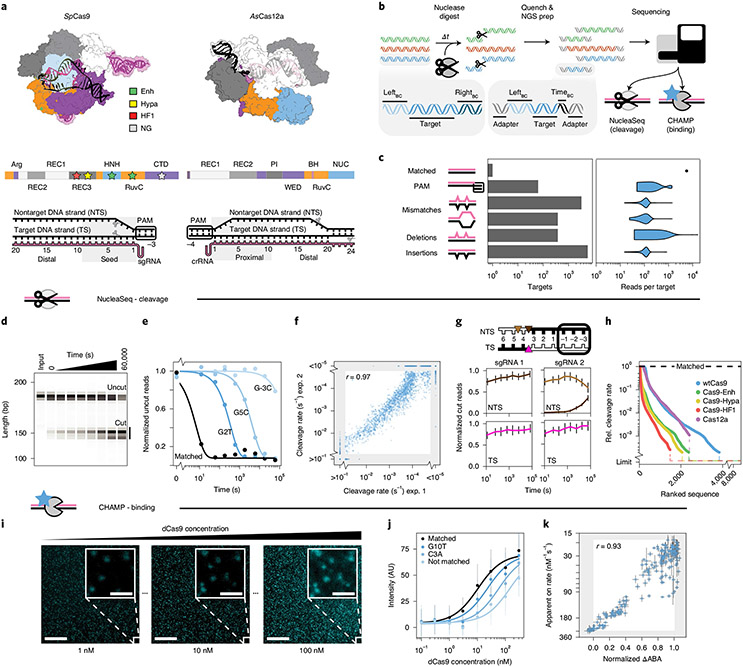
Fig. 1 ∣. Overview of the integrated NucleaSeq and CHAMP platform.
a, Crystal structures and domain maps of Cas9 and Cas12a RNP complexes (Protein Data Bank: 5F9R and 5B43). Stars: engineered Cas9 mutation sites. Scissors: cleavage sites. b, For NucleaSeq, a CRISPR–Cas nuclease digests a synthesized library of mispaired target DNAs under single-turnover conditions. DNAs contain unique left and right barcodes. Time point barcodes are added before NGS. NGS chips are recovered to profile DNA binding specificity via CHAMP. c, DNA libraries include targets with randomized PAMs or up to two guide-RNA-relative alterations. Right, read distribution by target type for CHAMP. d, A wtCas9 nuclease reaction time course (sgRNA 1) resolved by capillary electrophoresis. Each sample was run separately—two independent replicates for each. e, Cleavage rates are computed by fitting single exponential functions (lines) to uncut DNA depletions (circles). f, Cleavage rate reproducibility for wtCas9-sgRNA1 experiments. The gray area contains targets with rates beyond the experimental dynamic range. r: Pearson’s correlation coefficient excluding gray area. g, Cut DNA fragments from matched DNAs (black in diagram) report the time-dependent distribution of Cas9-generated cut sites in the TSs and NTSs. wtCas9-sgRNA1 cuts bluntly between the 3rd and 4th nucleotides (left). wtCas9-sgRNA2 produces a one-nucleotide 5′ overhang and then trims it off the NTS (right). Colors: cut positions (triangles in diagram). Error bars: median ± s.e.m. of n = 146 guide-RNA-matched library members. h, Ranked relative cleavage rates of all library members for all five nucleases. Limit: relative cleavage rate beyond detection limit. i, CHAMP reports the apparent binding affinity of nuclease-inactive CRISPR enzymes. Library DNAs on the surface of an NGS chip are incubated with increasing concentrations of a fluorescent dCas9 (cyan puncta). Their sequences are bioinformatically determined by comparison to the NGS output. Scale bar, 50 μm; inset, 5 μm. j, ABAs are computed by fitting Hill functions (lines) to mean fluorescence DNA clusters intensities (circles). AU, arbitrary fluorescence units. Median ± s.d. from bootstrap analysis of n ≥ 5 DNA clusters for each target. k, Correlation of dCas9 ΔABAs measured with CHAMP to dCas9 on-rates from a high-throughput assay33. ΔABA, change in apparent binding affinity from the matched target, normalized to that of a scrambled DNA. r: Pearson’s correlation coefficient. x axis: median ± s.d. from bootstrap analysis of n ≥ 5 DNA clusters for each target. y axis: median ± s.e.m. of n ≥ 6 for each target DNA33.

