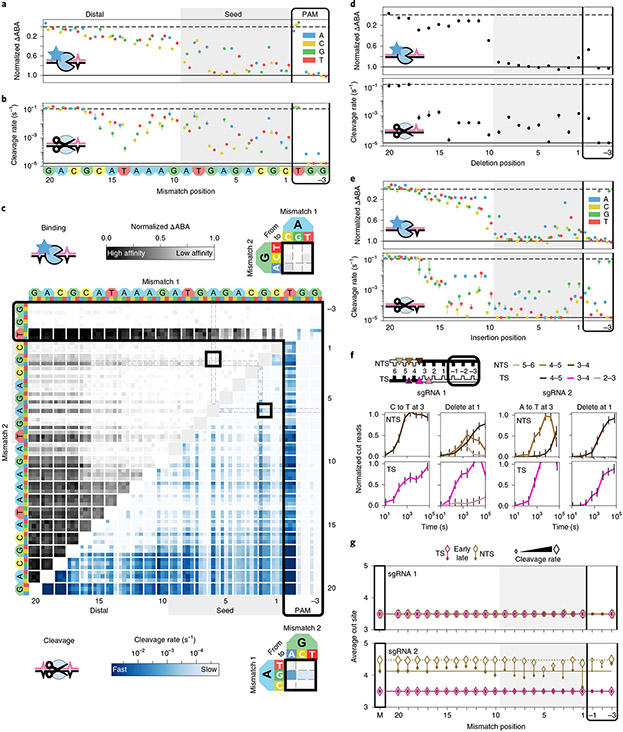
Fig. 2 ∣. Comprehensive analysis of off-target wtCas9 DNA binding and cleavage.
a, dCas9 ΔABAs for targets with one sgRNA1-relative mismatch. Dashed line: normalized matched target ΔABA (0); solid line: scrambled DNA ΔABA (negative control, 1). Median ± s.d. from bootstrap analysis of n ≥ 5 DNA clusters for each target. b, Cas9 cleavage rates for the same targets as in a. Dashed line: cleavage rate of the matched target; solid line: limit of detection for the slowest-cleaving targets. Error bars: s.d. from 50 bootstrap analysis measurements. c, ΔABAs (upper, grays) and cleavage rates (lower, blues) for targets containing two sgRNA1-relative mismatches. Black boxes expanded in callouts. d, dCas9 ΔABAs (upper, median ± s.d. from bootstrap analysis of n ≥ 5 DNA clusters for each target) and Cas9 cleavage rates (lower, error bars: s.d. from 50 bootstrap analysis measurements) for targets containing one sgRNA1-relative deletion or (e) insertion. f, Normalized reads for the TS and NTS of DNAs containing either a mismatch at position 3 (C3T or A3T) or a deletion at position 1 compared to sgRNA1 (left) or sgRNA2 (right). Error bars: maximum s.d. for cut products from cleavage of 146 matched DNA controls. g, Average cut site positions for each strand (TS and NTS) from DNAs containing one mismatch relative to sgRNA 1 (upper) or sgRNA 2 (lower). Range: earliest time point with more than 33% cut reads (open diamonds) to final time point (filled diamonds). Dashed and solid horizontal lines: mean cut site positions for 146 matched DNAs (M) at early and late time points.

