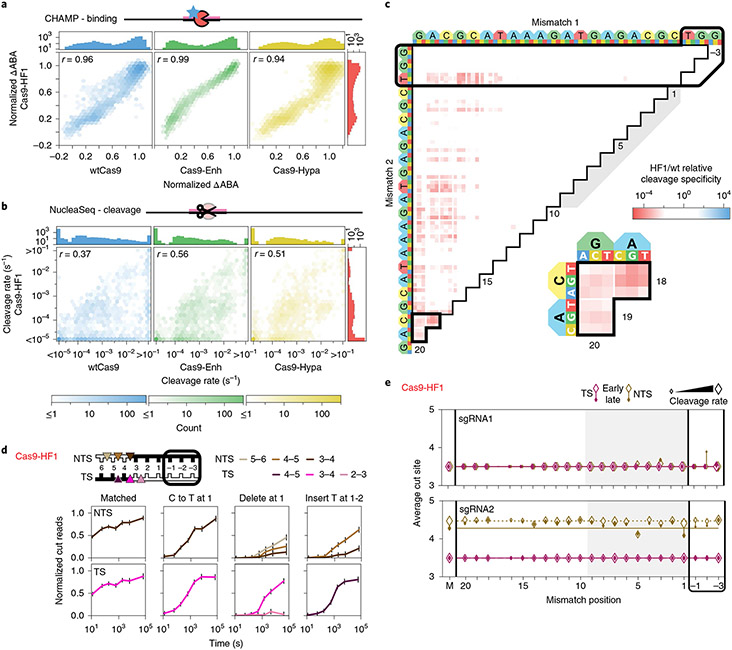
Fig. 3 ∣. Comparison of engineered Cas9 nucleases.
a,b, Two-dimensional density plots correlate Cas9-HF1 ΔABAs (a) and cleavage rates (b) with those from wtCas9, Cas9-Enh and Cas9-Hypa (sgRNA1). Histograms: all ΔABAs or cleavage rates for the respective nuclease. r: Pearson’s correlation coefficient. c, The ratio of Cas9-HF1 to wtCas9 cleavage specificities for targets with two sgRNA1-relative mismatches. Red: slower cleavage by Cas9-HF1; blue: slower cleavage by wtCas9. Black-outlined range expanded in callout. d, Cas9-HF1 cleavage patterns on the TS and NTS of select target DNAs (sgRNA1). Normalized counts of cut products comprising ≥10% of the total cut reads at any time point. Error bars: maximum s.d. for cut products from cleavage of 146 matched DNA controls. e, Average cut site positions generated by Cas9-HF1 for each strand (TS and NTS) for targets containing one sgRNA-relative mismatch. Range: earliest timepoint with more than 33% cut reads (open diamonds) to final time point (filled diamonds). Dashed and solid horizontal lines: mean cut site positions for 146 matched DNAs (M) at early and late time points.

