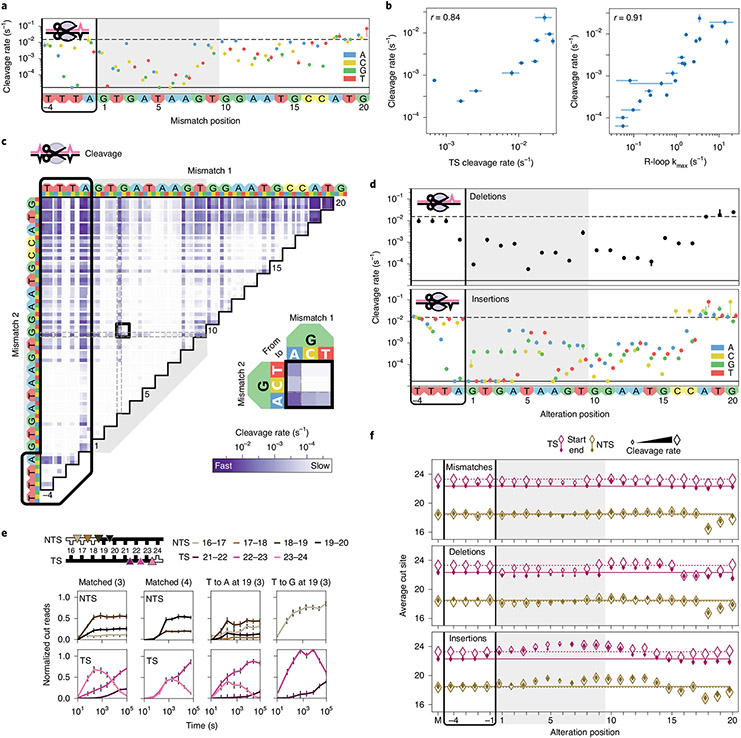
Fig. 4 ∣. Comprehensive analysis of off-target Cas12a cleavage.
a, Cas12a cleavage rates for DNAs containing one crRNA3-relative mismatch. Dashed line: cleavage rate of the matched target. Solid line: limit of detection for the slowest-cleaving targets. Error bars: s.d. from 50 bootstrap analysis measurements. b, Total cleavage rate compared to reported target strand cleavage (left) and R-loop propagation (right) rates32. Total cleavage rates error bars: s.d. from 50 bootstrap analysis measurements. TS cleavage and R-loop propagation rate error bars: rate from a hyperbolic fit ± s.d. from n = 3 independent experiments. r: Pearson’s correlation coefficient. c, Cleavage rates for targets with two crRNA3-relative mismatches. Black box expanded in callout. d, Cleavage rates for DNAs containing one crRNA3-relative deletion (upper) or insertion (lower). Error bars: s.d. from 50 bootstrap analysis measurements. Nucleotides inserted to the left of the given positions. e, Normalized reads for the TSs and NTSs of the indicated targets. Parenthesis: crRNA. Error bars: maximum s.d. for cut products from cleavage of 146 matched DNA controls. f, Average cut site positions for each strand (TS and NTS) from DNAs with one crRNA3-relative mismatch (upper), deletion (middle) or insertion (lower). Range: earliest time point with more than 33% cut reads (open diamonds) to final time point (filled diamonds). Dashed and solid horizontal lines: mean cut site positions for 146 matched DNAs (M) at early and late time points.

