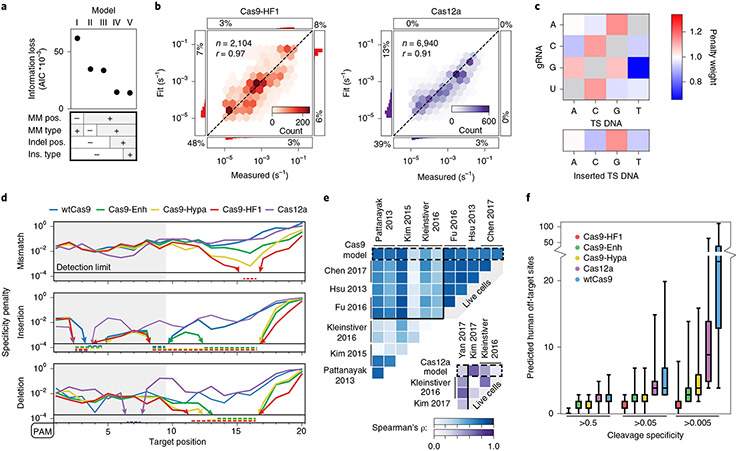
Fig. 5 ∣. Statistical modeling of CRISPR–Cas nuclease cleavage.
a, AIC values for five biophysical models relying on the indicated sequence parameters. The most detailed model (V) has the lowest AIC (information loss)—that is, the best goodness of fit. R-loop position-specific parameters reduce the AIC most. b, Correlation between measured and modeled cleavage rates for Cas9-HF1 (left, red) and Cas12a (right, purple) using model V. Histograms: distributions of fit or measured values beyond the upper and lower detection limits. Percentages: quantity of data with one or both values beyond detection limits. r: Pearson’s correlation coefficient. c, Base identity-dependent weights for mismatches and insertions averaged across all Cas9 and Cas12a enzymes. See Supplementary Fig. 8 and text for additional information. d, Modeled specificity penalties for one guide-RNA-relative mismatch (upper), insertion (middle) or deletion (lower). PAMs are oriented left for comparison. Arrows and dashed lines: values below the detection limit. e, The predicted reduction in mismatch-dependent cleavage rates correlates with previous high-throughput measurements of reduced edit efficiencies for wtCas9 (blue) and Cas12a (purple). See Methods for associated data. ρ: Spearman’s correlation coefficient. f, The number of off-target sites in the human genome with a predicted cleavage specificity greater than the indicated specificity threshold. For each nuclease, n = 1,000 targets, selected randomly from exomic DNA. The cleavage specificities of the potential off-target cleavage sites across the genome were calculated using model V. Top whisker (maxima): top of 90% confidence interval; top box: third quartile; center line: median; lower box: second quartile; lower whisker (minima): bottom of 90% confidence interval.

