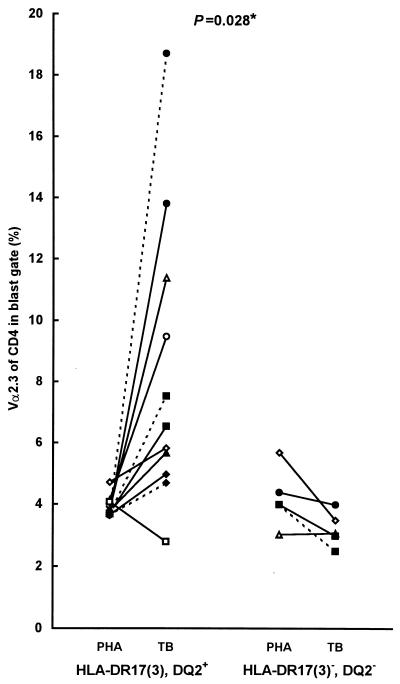
FIG. 4.
TCR Vα2.3 expression of CD4+ T cells (blast gate), upon in vitro stimulation with live M. tuberculosis (TB) or its soluble extract (SN1), in eight HLA-DR17, DQ2-positive and four negative individuals. The ratio of Vα2.3 expression in Mycobacterium-stimulated and PHA-stimulated T cells was compared between the two groups of subjects by the nonparametric, two-tailed Mann-Whitney U test. Continuous lines, soluble extract; dashed lines, live M. tuberculosis (each symbol represents a different individual).

