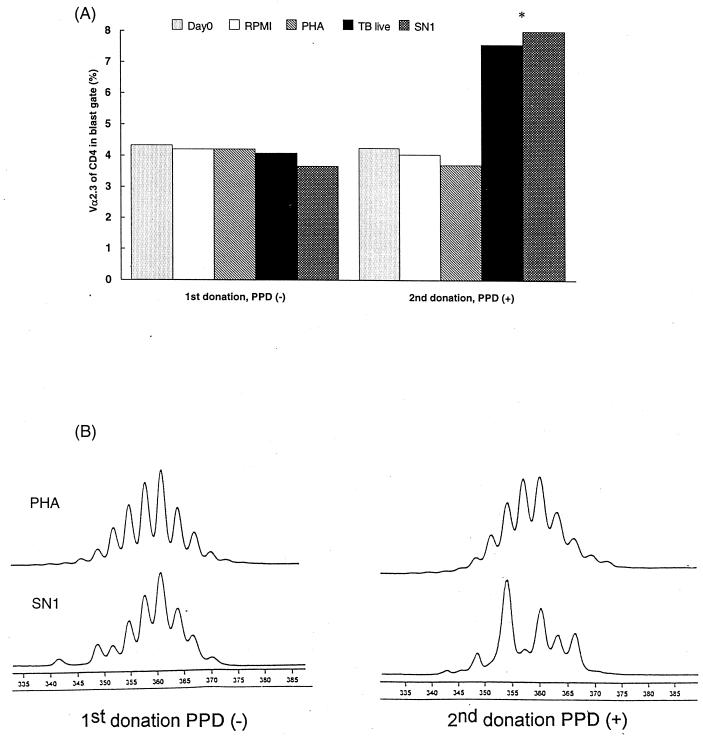
FIG. 7.
TCR Vα2.3 expression (A) and CDR3 length analyses of Vα2.3+ T cells (B) upon in vitro stimulation with mycobacterial antigens and PHA in an HLA-DR17(3), DQ2+ individual before and 8 months after BCG vaccination. (A) When there was not a significant number of events in the blast gate due to low proliferation, the resting-cell gate was used for calculations (i.e., Day0 and antigen-free culture [RPMI] for both donations, TB live and SN1 for the first donation). (B) The vertical axis represents the relative quantity (arbitrary fluorescence units), while the horizontal axis denotes the length in base pairs.

