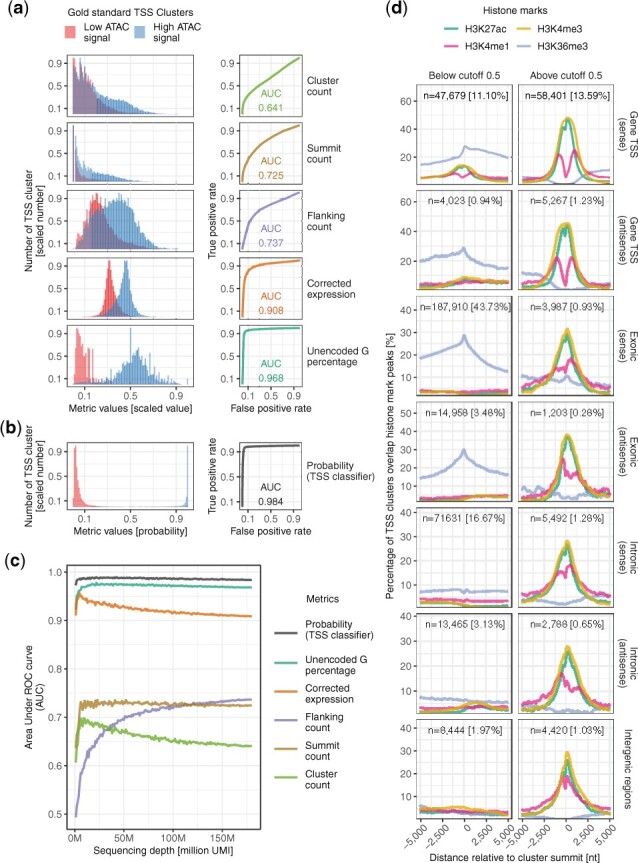
Fig. 1.

De novo identification of genuine TSS. (a) Distribution of TSS clusters properties (left) and their classification performances measured as AUC (right). (b) Distribution of probability (TSS classifier) (left) and its classification performance measured as AUC (right). (c) Performance of various metrics as a TSS classifier in (a) and (b) across various sequencing depths. (d) Histone marks at TSS clusters with a probability below (left) or above (right) 0.5 cutoff, at annotated gene TSS, exonic or intronic regions in sense or antisense orientations, or otherwise intergenic regions. n, number of TSS clusters; %, percentage of TSS clusters in all genomic locations regardless of probability thresholds
