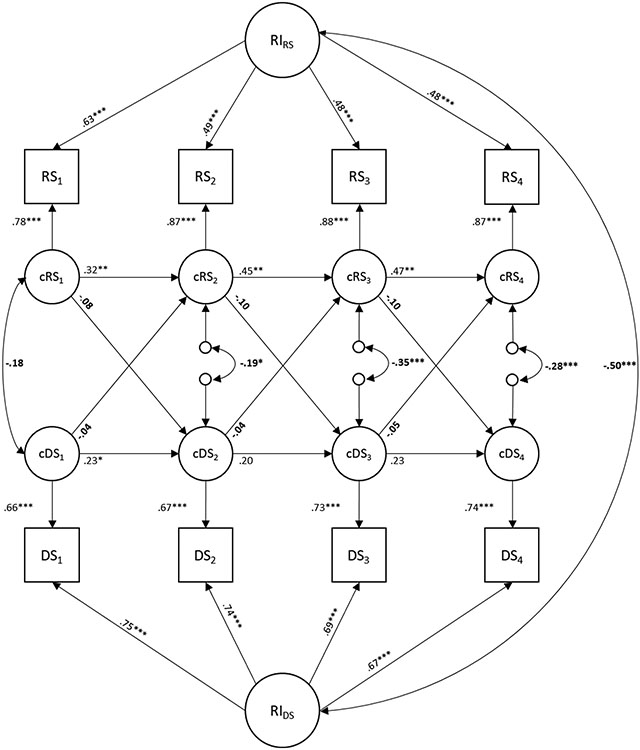
Figure 1.
Random intercept cross-lagged panel model (RI-CLPM) of the relationship between relationship satisfaction (RS) and depressive symptoms (DS) across four waves (denoted in subscripts), with ~8-month time lags between waves. Squares represent observed variables and circles represent latent variables. RI represents random intercepts and c represents within-person centered. All estimates are standardized. Sex was included as control variable (not shown). Parameters involving associations between RS and DS shown in bold typeface.
+p < .10. *p < .05. **p < .01. ***p < .001.

