
Figure 2.
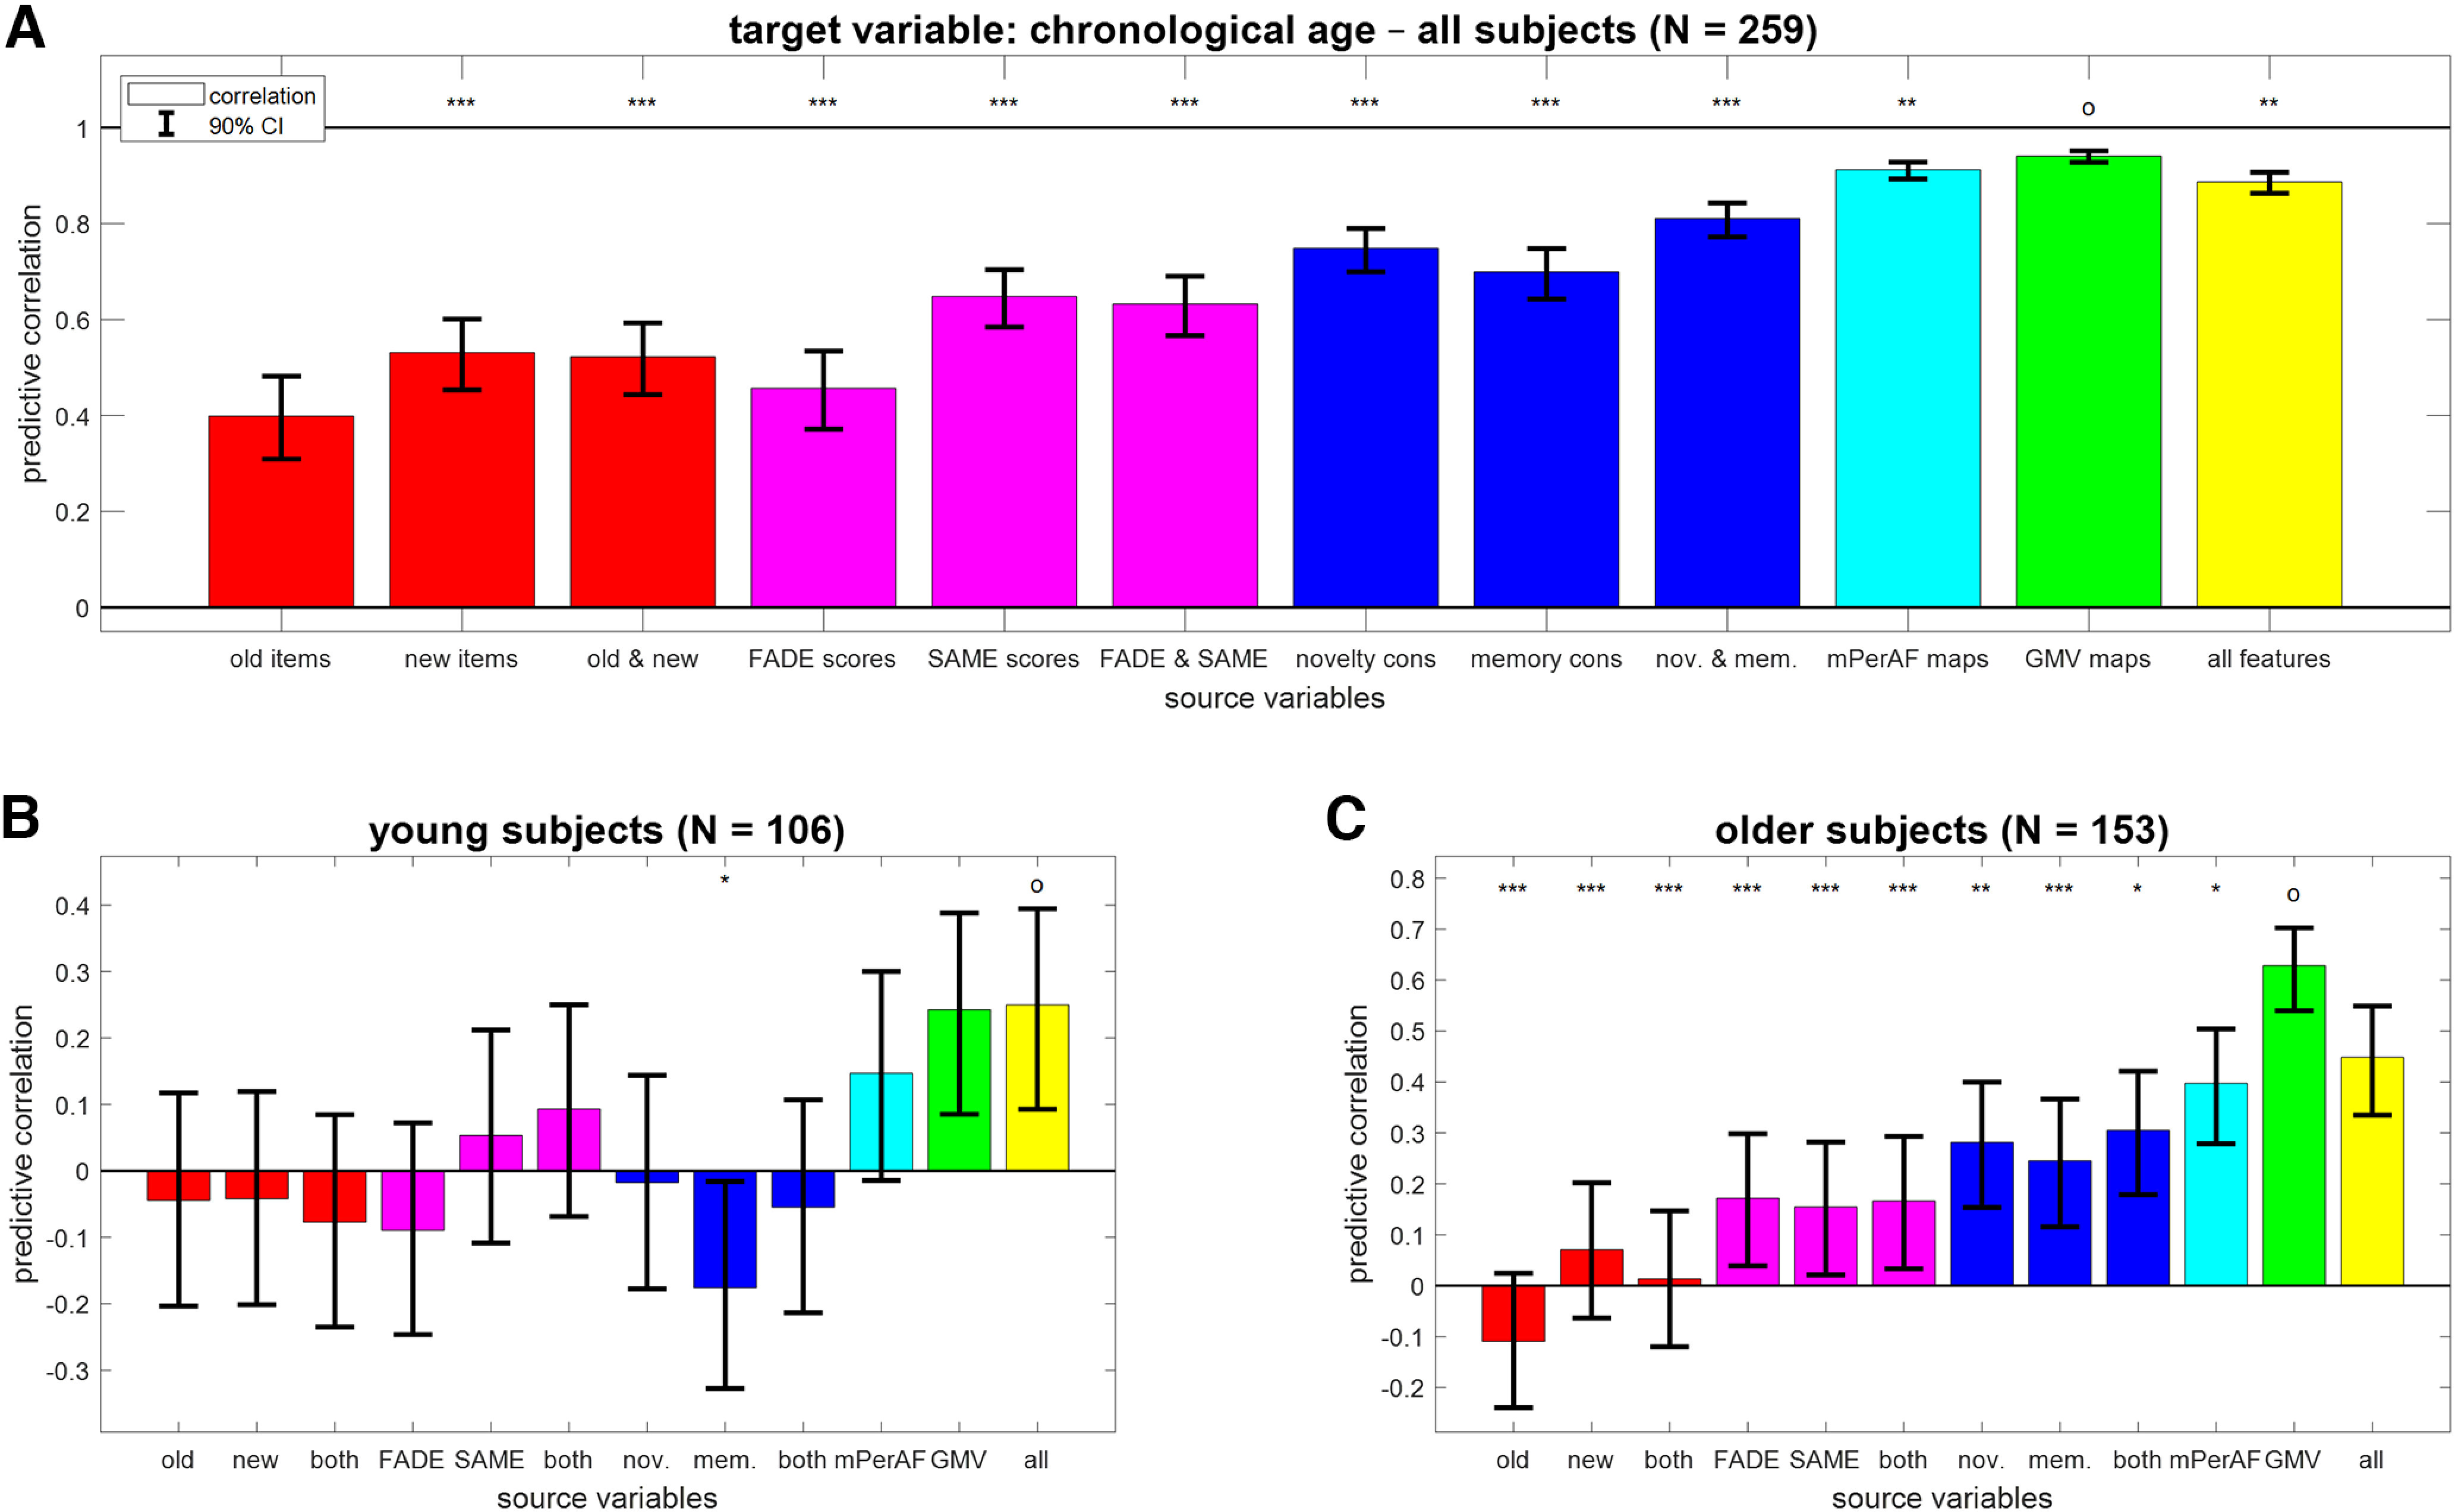
Prediction of chronological age from different feature sets. Bar plots show correlation coefficients for predicting chronological age (in years; A) across all subjects, (B) in young subjects only, or (C) in older subjects only from behavioral data (red), fMRI scores (magenta), task-based fMRI contrasts (blue), resting-state fMRI maps (cyan) and structural MRI (green), or all features (yellow). Error bars denote 90% CIs; x-axis labels are explained in Table 4. The feature set with the highest predictive correlation is denoted with an “o”; other feature sets are labeled with asterisks to indicate significantly different MAE (*p < 0.05, **p < 0.01, ***p < 0.001, otherwise not significant). For classification of age group from these features, see Extended Data Figure 2-1.