
Figure 3.
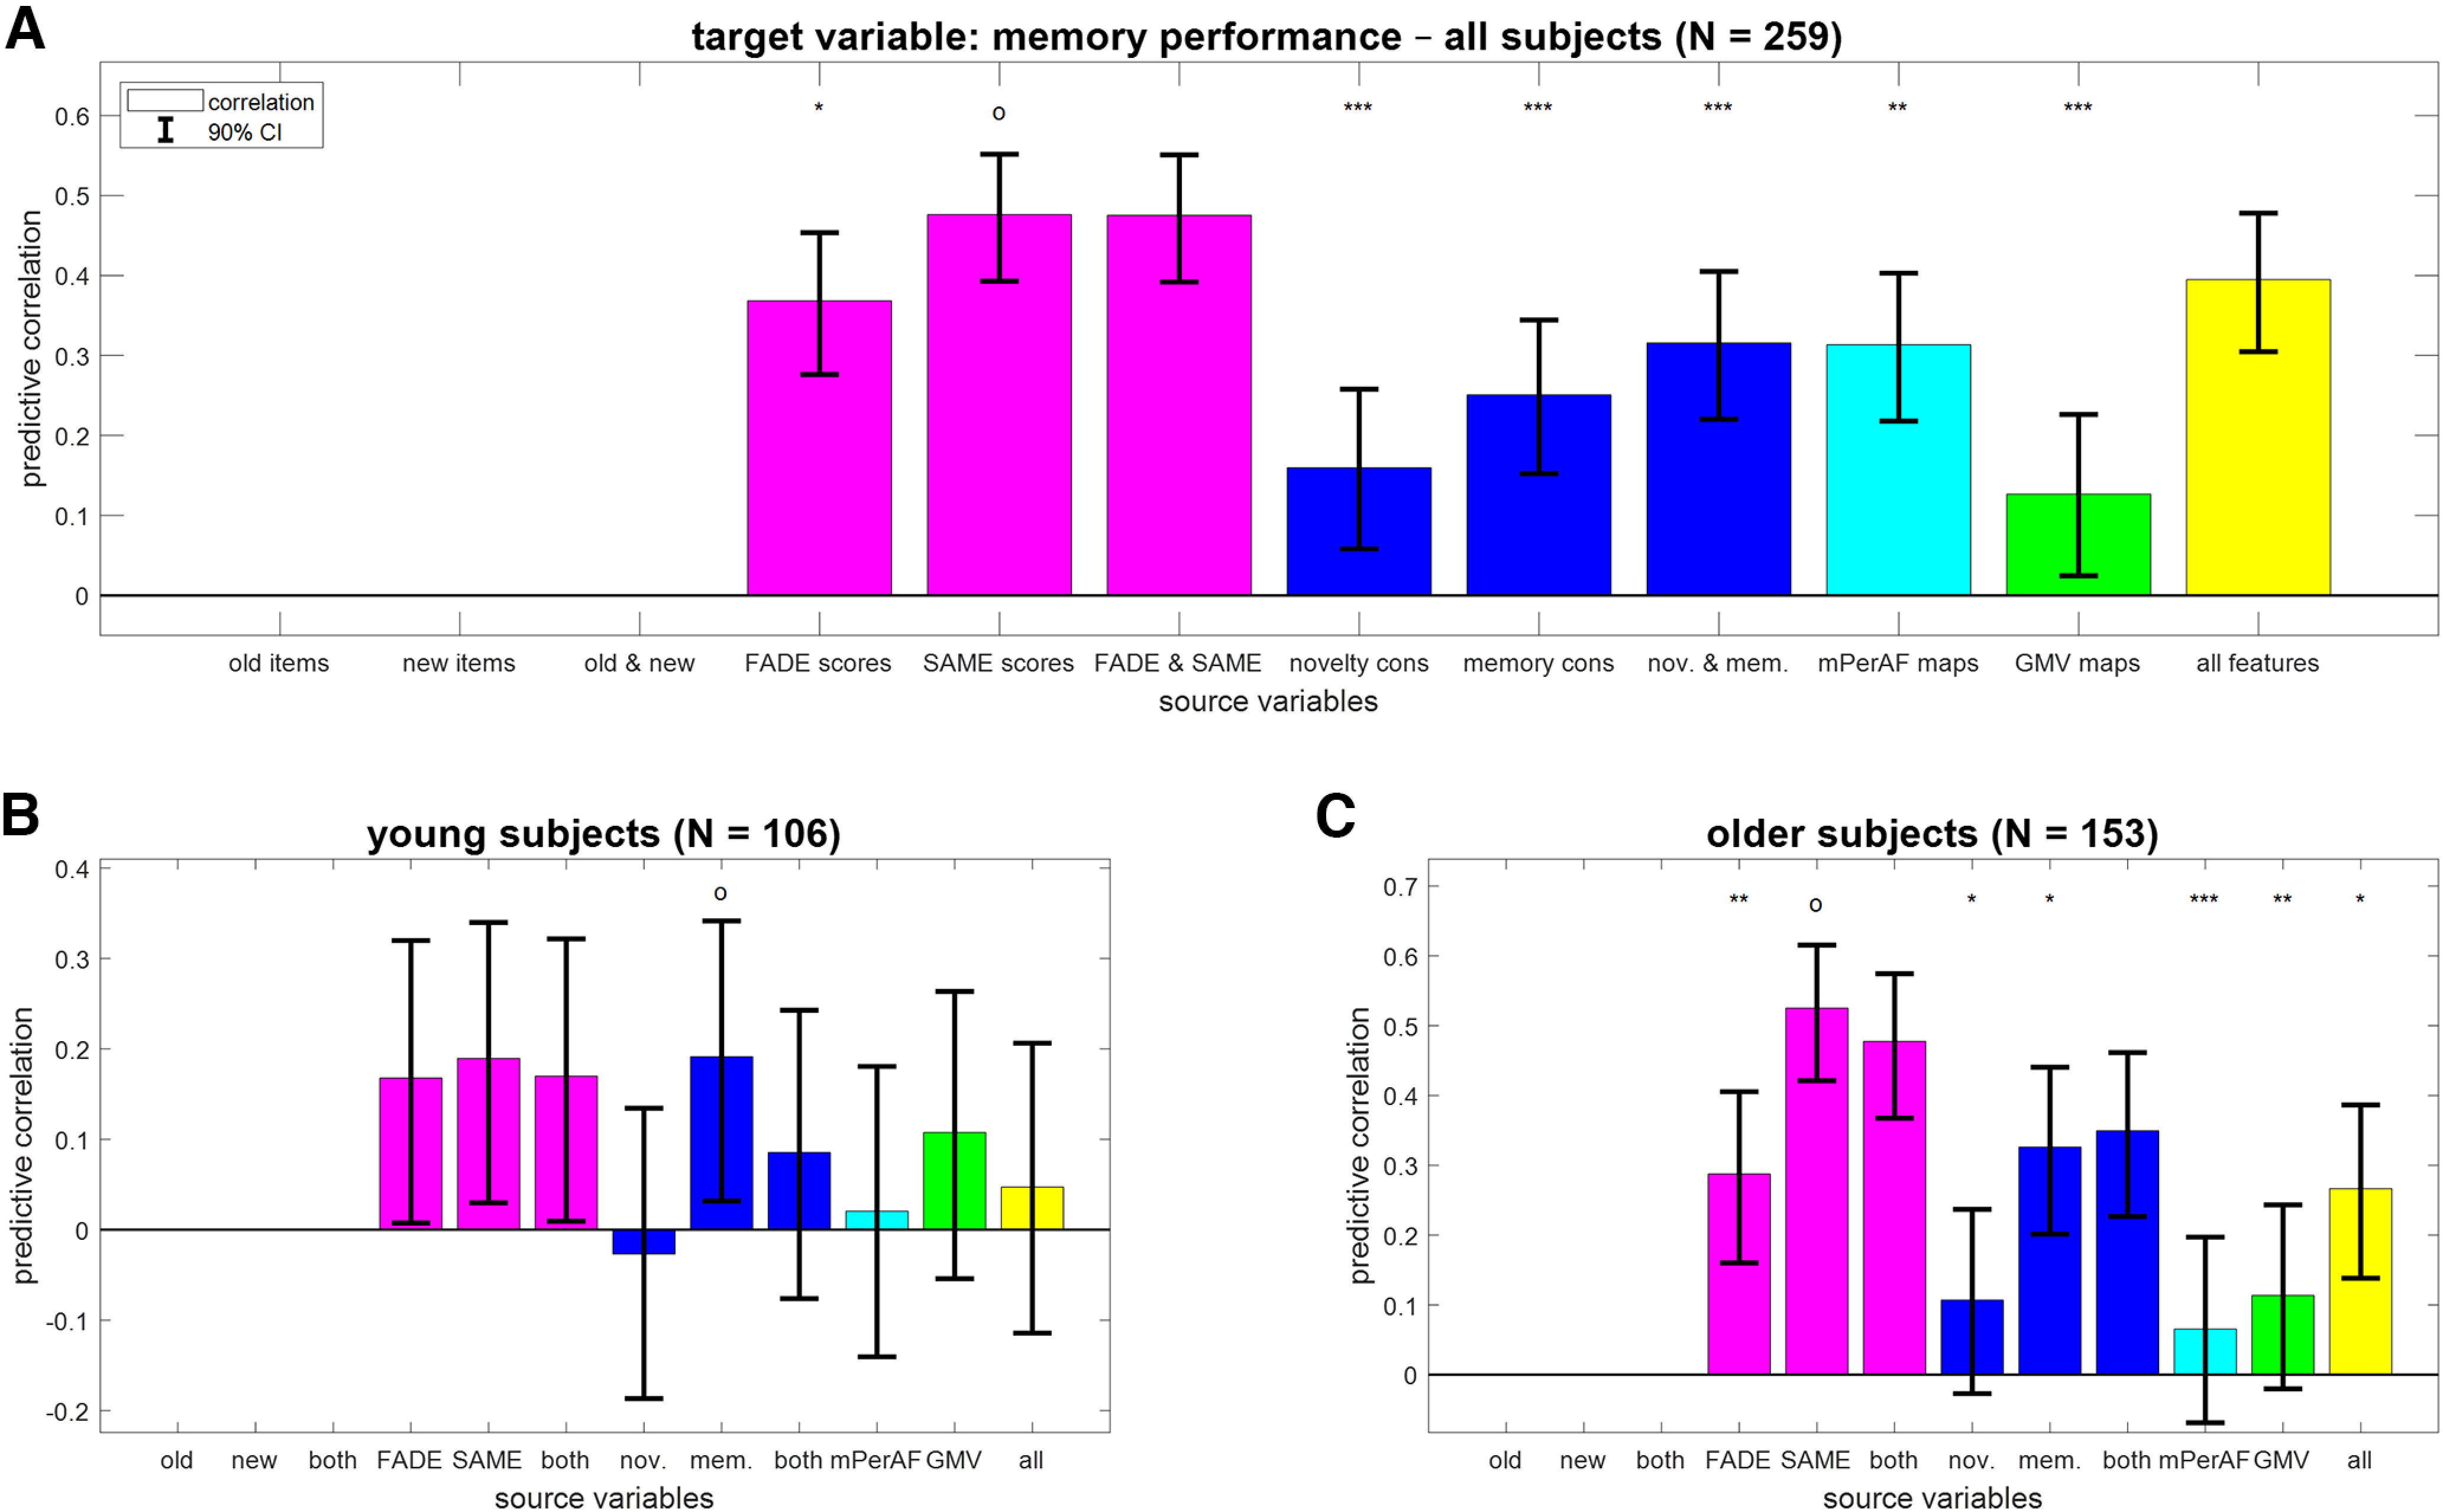
Reconstruction of memory performance from different feature sets. Bar plots show correlation coefficients for predicting memory performance (AUC; A) across all subjects, (B) in young subjects only, or (C) in older subjects only from fMRI scores (magenta), task-based fMRI contrasts (blue), resting-state fMRI maps (cyan) and structural MRI (green), or all features (yellow). Note that memory performance can be directly derived from behavioral data which is why the corresponding prediction analyses were not performed. The layout follows that of Figure 2.