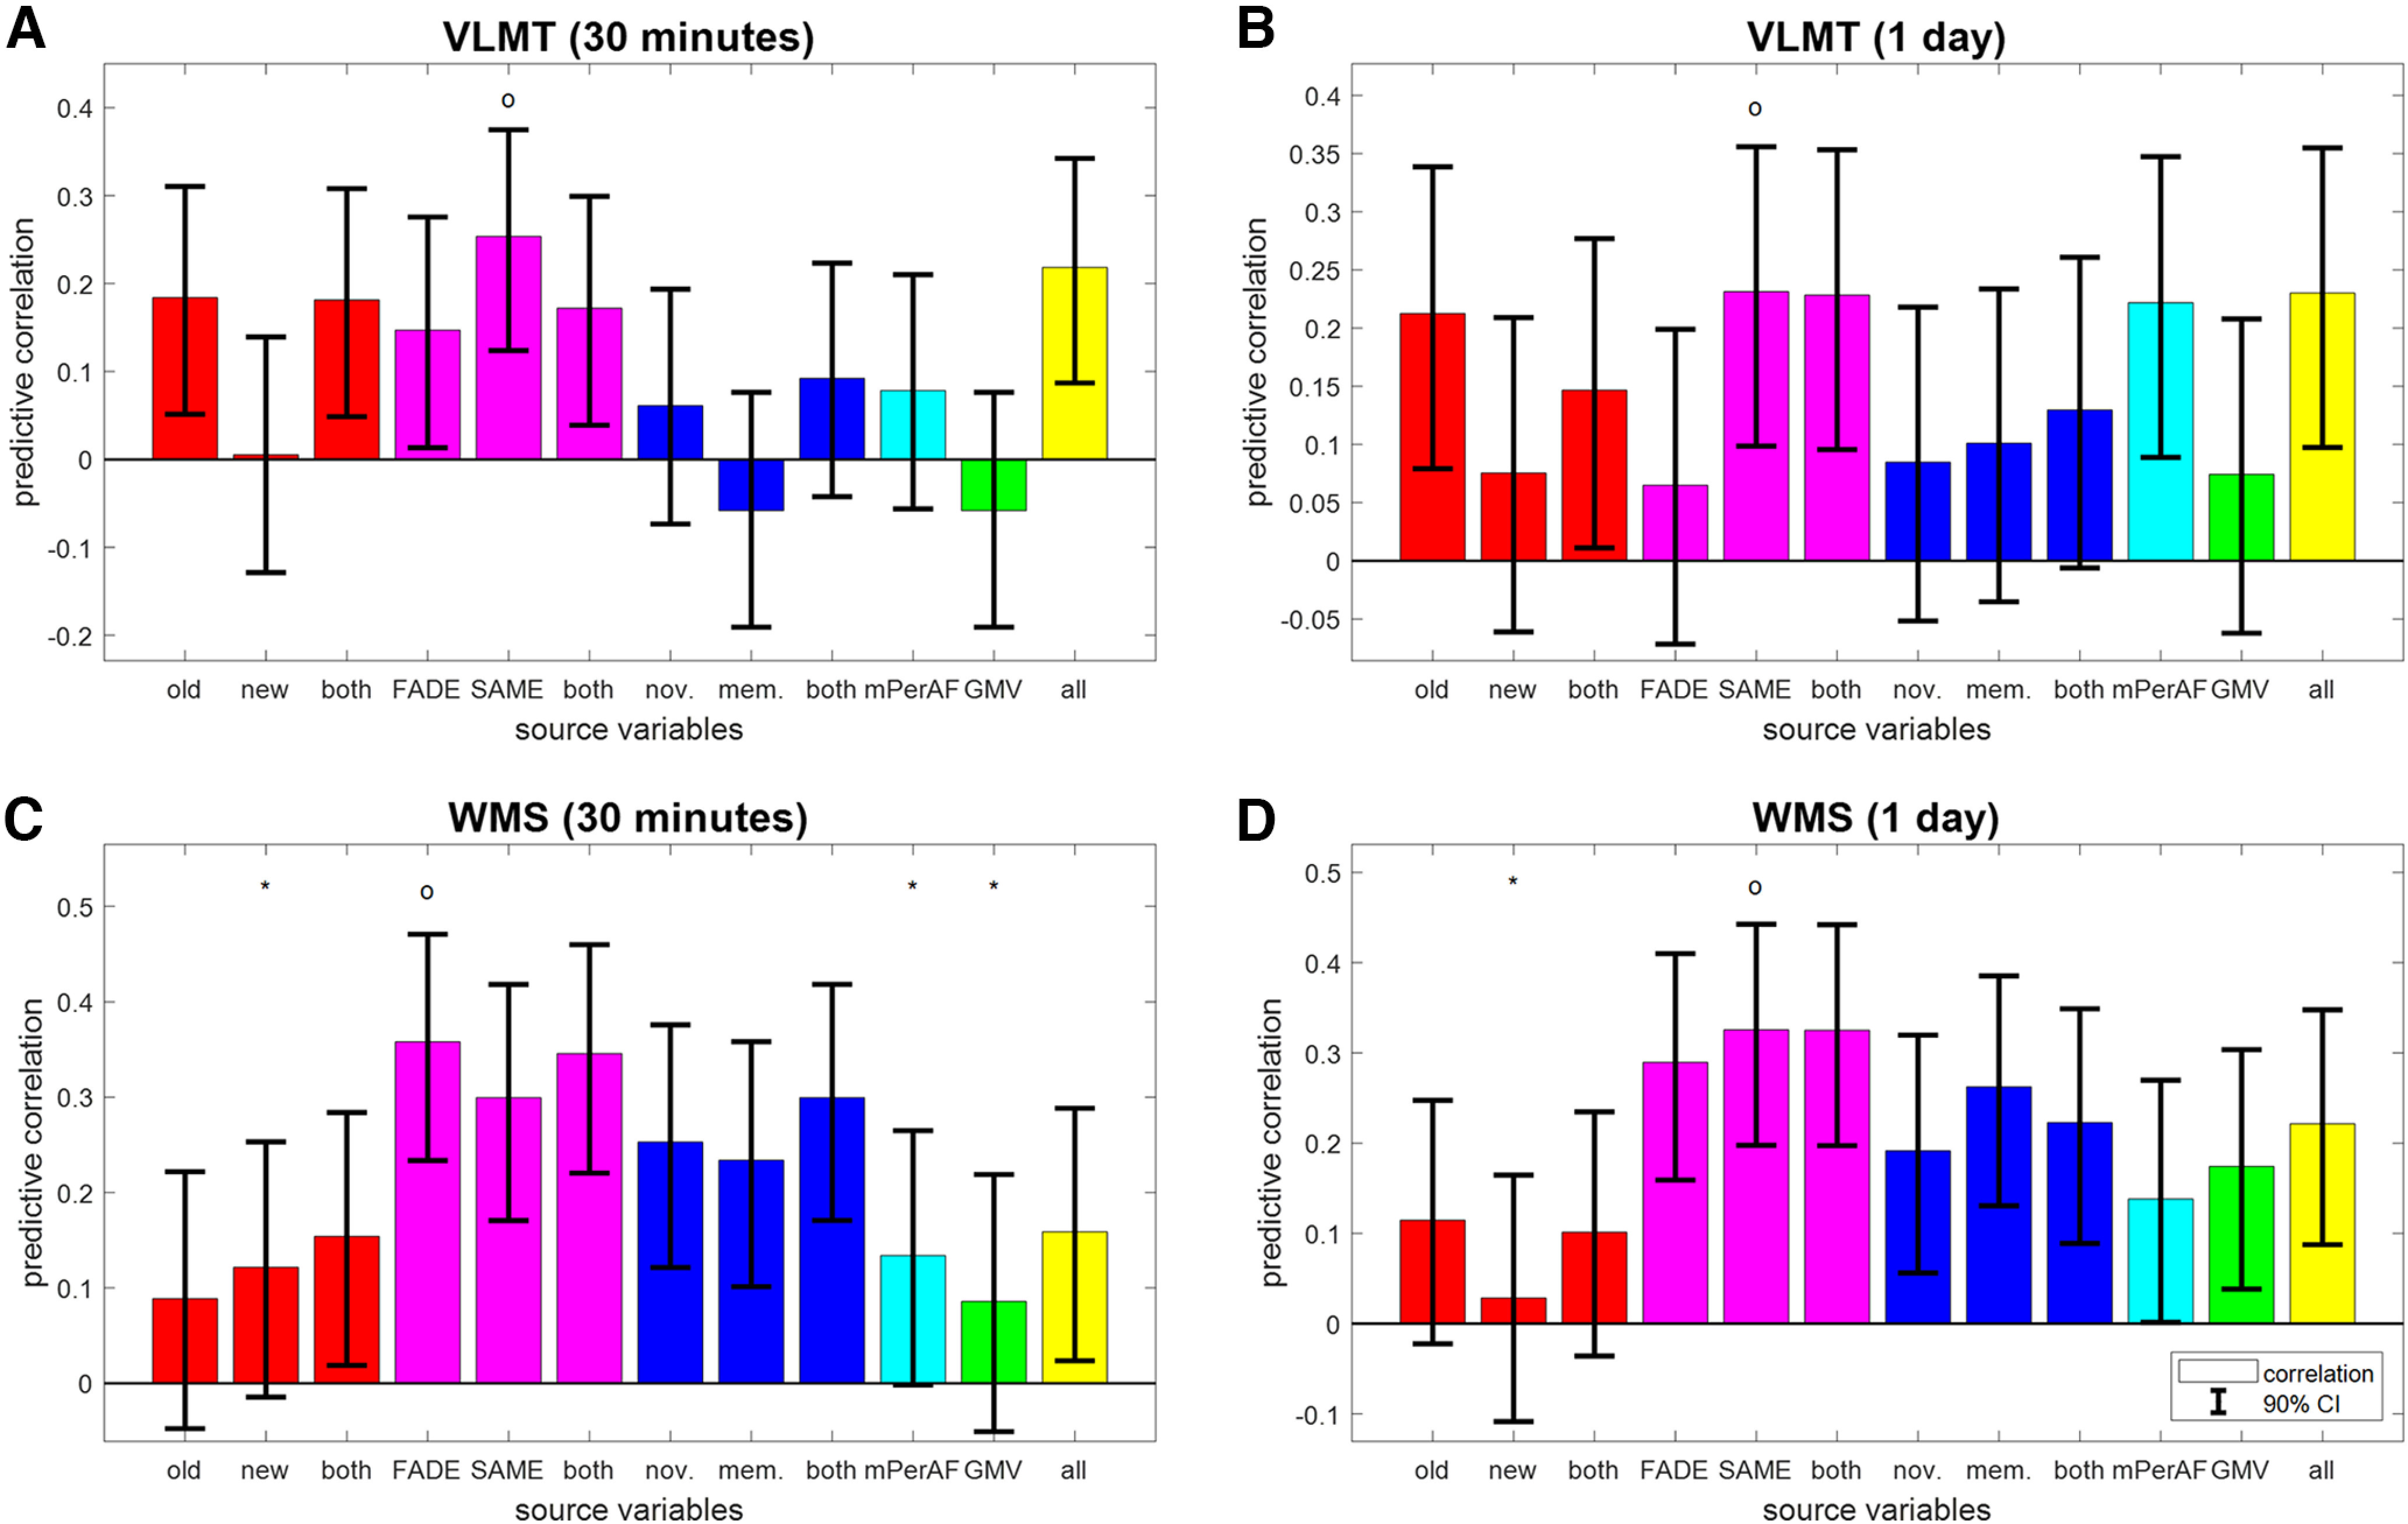
Figure 4.

Reconstruction of independent memory performance in older subjects. Bar plots show correlation coefficients for predicting, in older subjects only, independent measures of memory performance, namely, (A) VLMT items after 30 min, (B) VLMT items after 1 d, (C) WMS points after 30 min, and (D) WMS points after 1 d, from behavioral data (red), fMRI scores (magenta), task-based fMRI contrasts (blue), resting-state fMRI maps (cyan) and structural MRI (green), or all features (yellow). The layout follows that of Figure 3C. For prediction of memory performance in young subjects, see Extended Data Figure 4-1.
