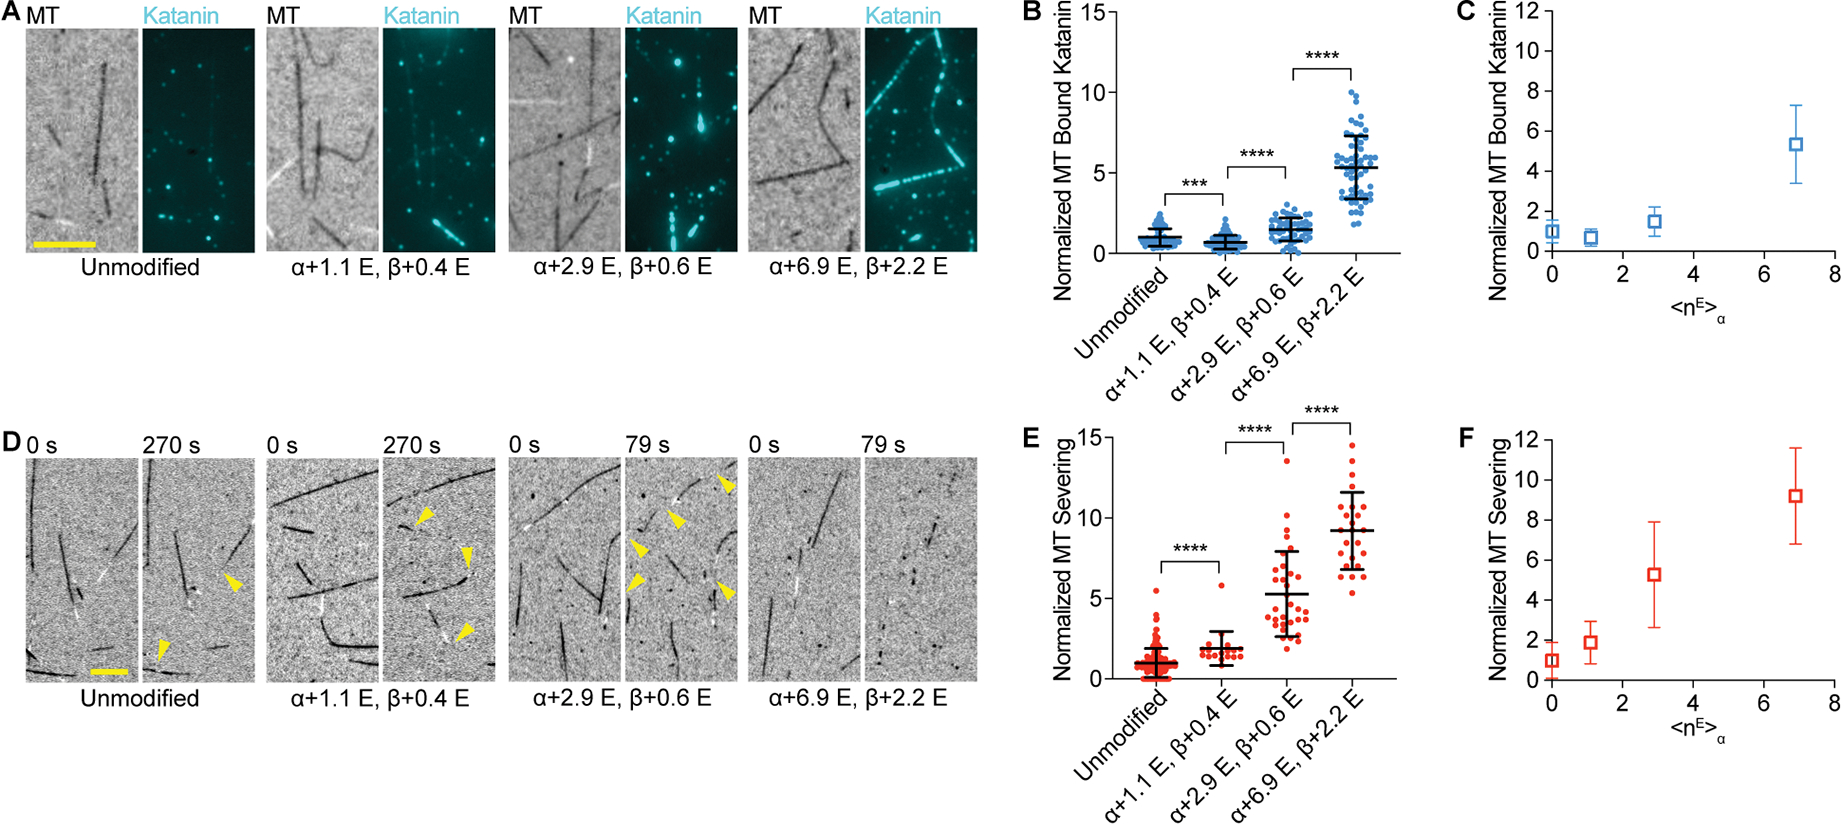
Figure 1. Proportional stimulation of microtubule severing by polyglutamylation on the α-tubulin tail by TTLL6.

(A) Katanin association with unmodified and glutamylated microtubules with increasing glutamylation levels added by TTLL6. The weighted mean of the number of glutamates (<nE>) added to α- and β-tubulin are denoted α + <nE>; β + <nE>. Assays at 4 nM katanin, 1 mM ATP; Scale bar, 5 μm.
(B) Katanin recruitment to microtubules increases with TTLL6-catalyzed glutamylation levels. Katanin levels normalized to those on unmodified microtubules; n=52, 75, 52 and 62 microtubules from multiple chambers for unmodified and <nE>α ~ 1.1, 2.9 and 6.9, respectively.
(C) Normalized katanin levels bound to microtubules as a function of glutamates added on α-tubulin by TTLL6.
(D) Severing of unmodified and glutamylated microtubules with increasing glutamylation levels added by TTLL6. Time after end of katanin perfusion shown above. Reactions at 20 nM katanin, 1 mM ATP; cellular katanin concentrations ~ 3–28 nM130,131,132. Yellow arrows, severing. Scale bar, 5 μm.
(E) Severing increases with TTLL6-catalyzed glutamylation levels. Severing rates normalized to that of unmodified microtubules (STAR Methods); n = 152, 18, 32 and 24 microtubules from multiple chambers for unmodified and <nE>α ~ 1.1, 2.9 and 6.9, respectively.
(F) Normalized severing as a function of glutamates added on α-tubulin by TTLL6; Mean and S.D., p-value ≤ 0.001 (***), 0.0001 (****) by Mann-Whitney or t-test. LC-MS of microtubules and additional data in Figure S1.
