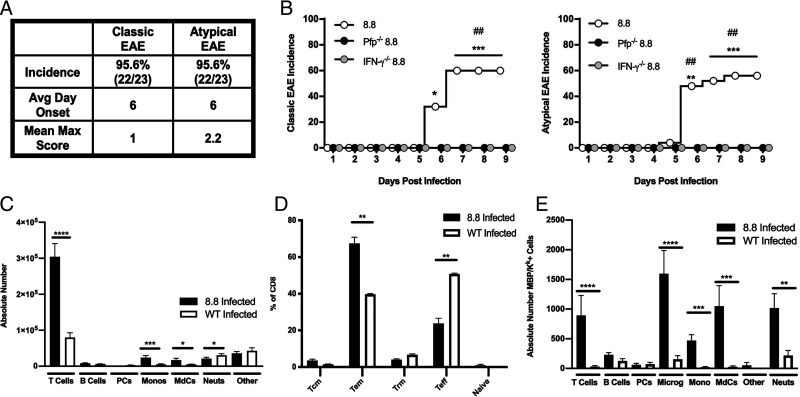
FIGURE 1.
Virally activated 8.8 T cells induce EAE via an IFN-γ– and perforin-mediated mechanism. (A and C–E) Intact 8.8 TCR-transgenic and WT female mice were infected with Vac-WT virus; (B) female WT mice that received either 8.8, 8.8 IFN-γ−/−, or 8.8 Pfp−/− CD8 T cells were infected with Vac-MBP virus. (A) Incidence, day of onset, and mean maximum clinical score corresponding to classic or atypical EAE symptoms are shown for 8.8 mice infected with Vac-WT (n = 23), compiled from five independent experiments). (B) This experiment used the adoptive transfer disease induction protocol in which WT mice were injected with CD8 T cells enriched from either WT mice or 8.8 mice on the indicated genetic backgrounds and then the recipient mice were infected with Vac-MBP. The cumulative incidence of classic (left) and atypical (right) clinical signs seen each day following infection of recipient WT mice that received 8.8 (n = 25), 8.8 IFN-γ−/− (n = 15), or 8.8 Pfp−/− (n = 7) CD8 T cells, compiled from three independent experiments. (C) Absolute numbers of infiltrating immune cells was determined by flow cytometry in the brains of 8.8 (n = 11) and WT (n = 7) mice infected with Vac-WT. Gating strategy is shown in Supplemental Fig. 1A. (D) Percentages of CD8 T cells exhibiting either a naive, Tcm, Trm, Tem, or Teff phenotype in the brains of 8.8 mice (n = 15) or WT mice (n = 8) at 8 d postinfection with Vac-WT were determined by flow cytometry and compiled from four independent experiments. Graphs show mean ± SEM; gating strategy is shown in Supplemental Fig. 1B. (E) The absolute numbers of MBP/Kk+ cells in the brains of 8.8 (n = 11) and WT (n = 7) mice were determined by flow cytometry at 8 d after Vac-WT infection. Graphs show mean ± SEM and are compiled from three independent experiments. Gating strategy is shown in Supplemental Fig. 1C. Statistical significance was determined in (B) with a Fisher’s exact test: *p < 0.05, **p < 0.01, ***p < 0.001, for differences between infected mice that received 8.8 CD8 T cells and mice that received 8.8 IFN-γ−/− cells; ##p < 0.01, for differences between infected mice that received 8.8 CD8 T cells and mice that received 8.8 Pfp−/− cells. Statistical significance in (C)– (E) was determined using a Mann–Whitney U test: *p < 0.05, **p < 0.01, ***p < 0.001, ****p < 0.0001.

