
Figure 1.
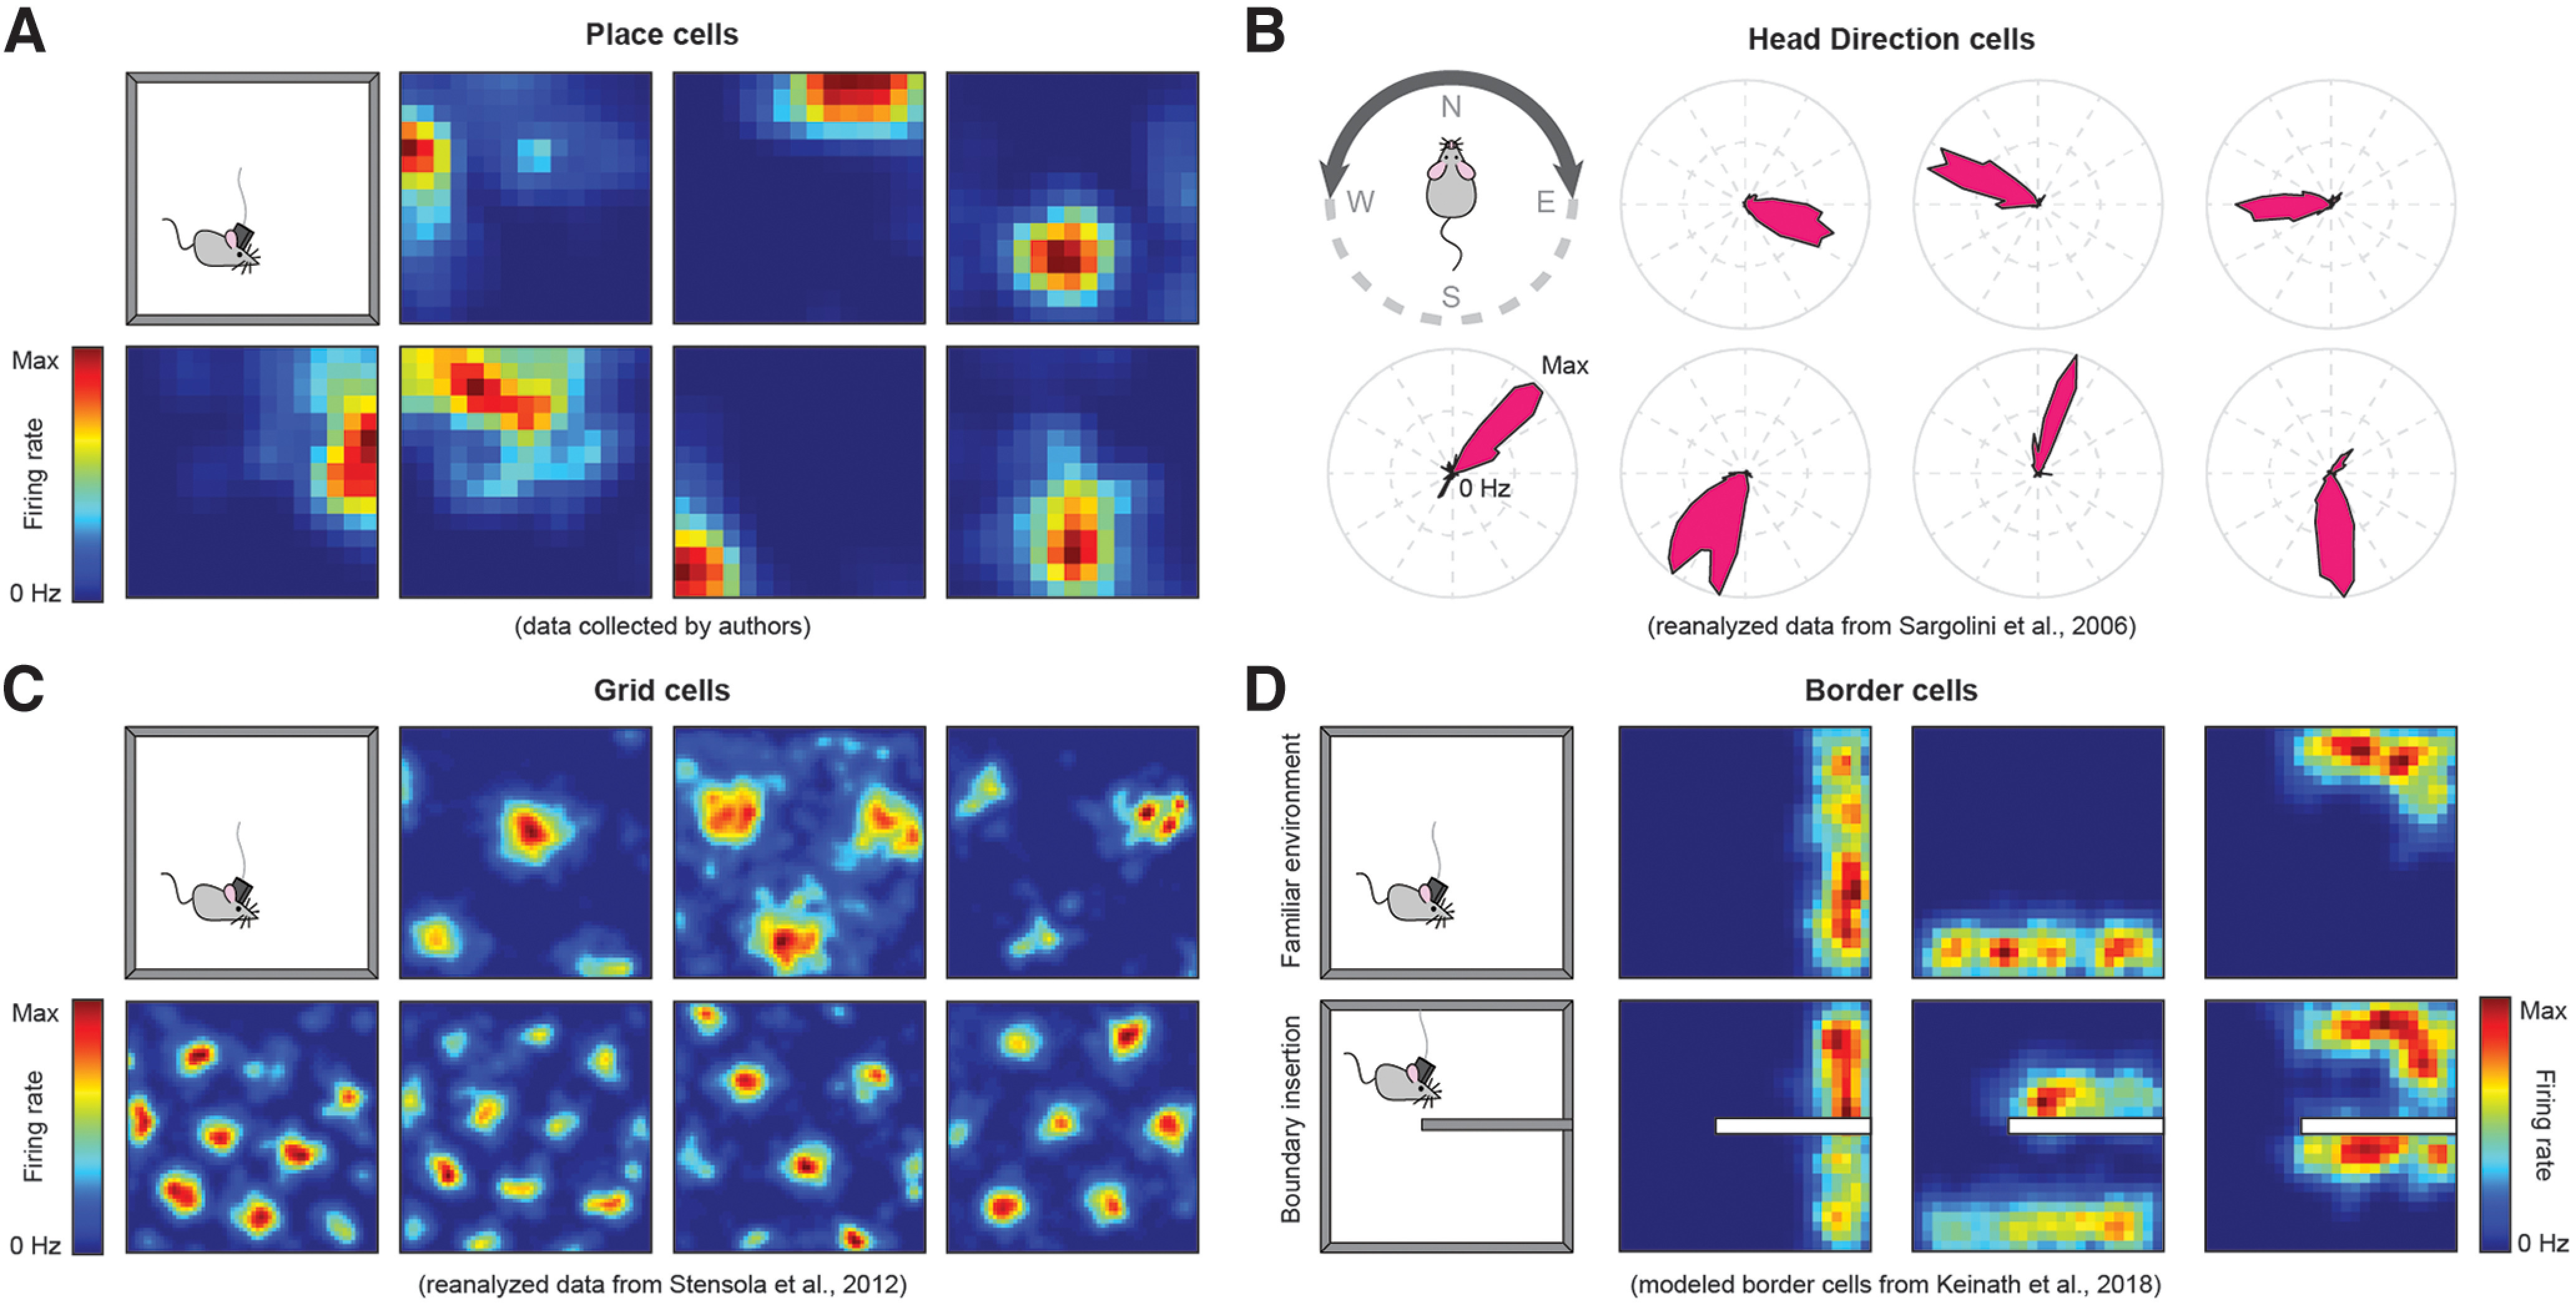
Examples of cell types exhibiting distinct patterns of tuning to different spatial variables. A, Heat maps represent the firing rates of seven example place cells. Note the tuning to distinct locations throughout the environment. B, Radial plots of the firing rate for seven example head direction cells. Preferred orientations span all directions. C, Heat maps represent the firing rates of seven example grid cells. D, Heat maps represent the firing rates of three example synthetic allocentric border cells in an open field and when a boundary is inserted. Note the duplication of firing nearby and at a similar allocentric direction to the inserted boundary.