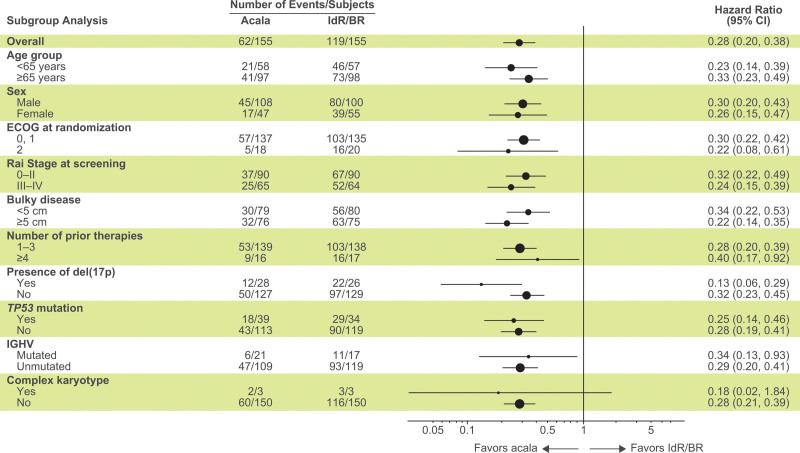
Figure 2.
Subgroup analysis of investigator-assessed progression-free survival. Forest plot showing progression-free survival analyzed by prespecified subgroups according to baseline demographic and clinical characteristics. Hazard ratios were based on stratified Cox proportional-hazards model, stratified by randomization stratification factors as recorded in interactive voice/web response system. Data for the del(17p) subgroup analysis are based on those recorded in IXRS. BR = bendamustine plus rituximab; CI = confidence interval; ECOG PS = Eastern Cooperative Oncology Group performance status; IdR = idelalisib plus rituximab; IGHV = immunoglobulin heavy chain variable region genes; IXRS = interactive voice/web response system; NE = not estimable; TP53 = tumor protein p53.

