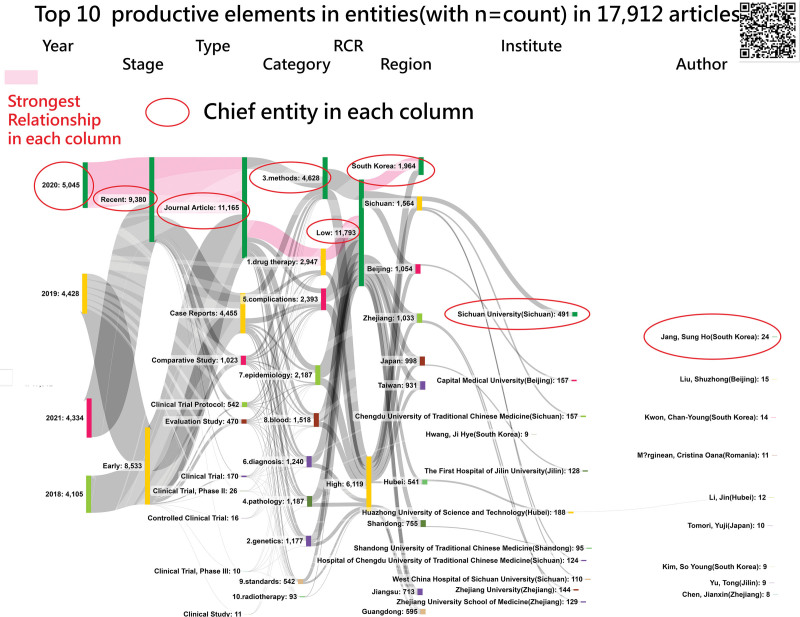
Figure 3.
Sankey diagram of the top ten elements in entities (note: nodes and edges are sizes by publications and flow momentum; the larger node means more publications; the wider edge represents more flow counts between 2 adjacent members; details are at the link[36]).

