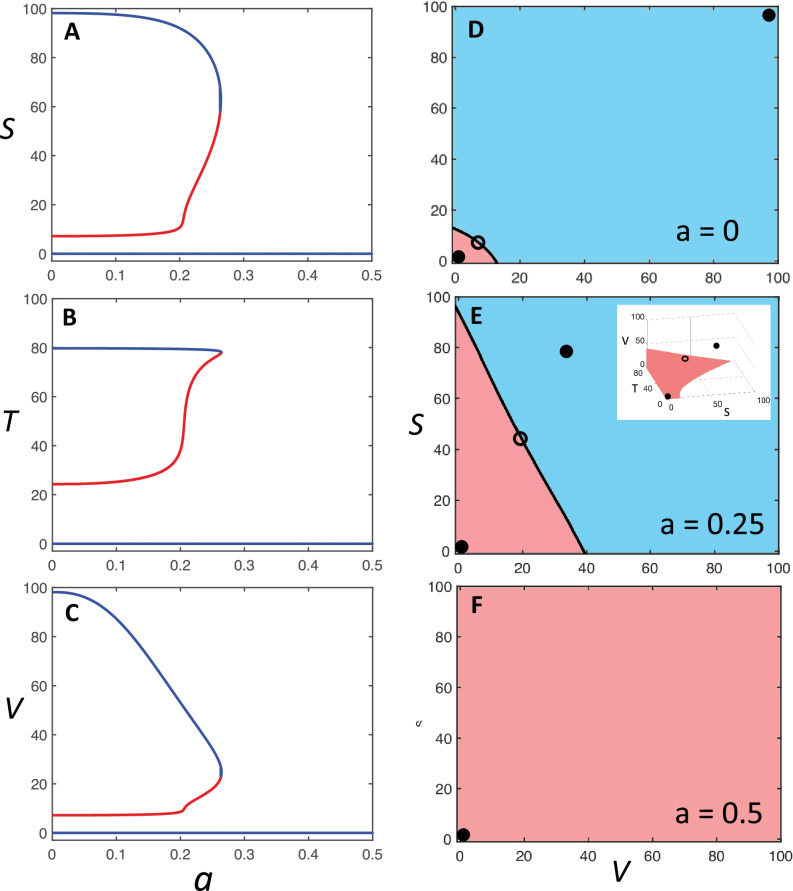
Fig. 2.
Bifurcation diagrams and phase portraits of the loop system. (A, B, C) Bifurcation diagrams: curves reporting the steady states of variables S (panel A), T (panel B), and V (panel C) as a function of the bifurcation parameter a, which represents the strength of inhibitory GABAergic transmission, i.e. the fraction of its full efficiency. The values of S, T, and V are expressed as mean firing rate (Hz), while a is a coefficient ranging in the interval 0 – 1, of which only the subset 0 – 0.5 is shown. Curve branches in blue represent stable equilibrium points, or steady states, and branches in red unstable ones. Upon decrease of a, the system reaches a bifurcation point where it undergoes a transition from monostability, with a single stable equilibrium point, to bistability, with two stable equilibrium points and an unstable one. The low-firing-rate steady state is assumed to represent the physiological condition, while the high-firing-rate steady state represents the pathogenic condition. (D, E, F) Bidimensional phase portraits in the V/S plane showing the basins of attraction of stable equilibrium points (black filled dots) for different values of a and for T = 80, i.e. the maximal value of the T variable, at which the basin of attraction of the low-firing-rate equilibrium point is the widest. The basin of attraction of the high-firing-rate steady state is in light blue, and that of the low-firing-rate steady state in light red. Unstable equilibrium points (open dots) are also shown. The plot in panel E corresponds to a value of immediately below the bifurcation point, while the inset shows the corresponding 3D phase portrait in the S/T/V space, where only the low-firing-rate basin of attraction is colored (in light red).

