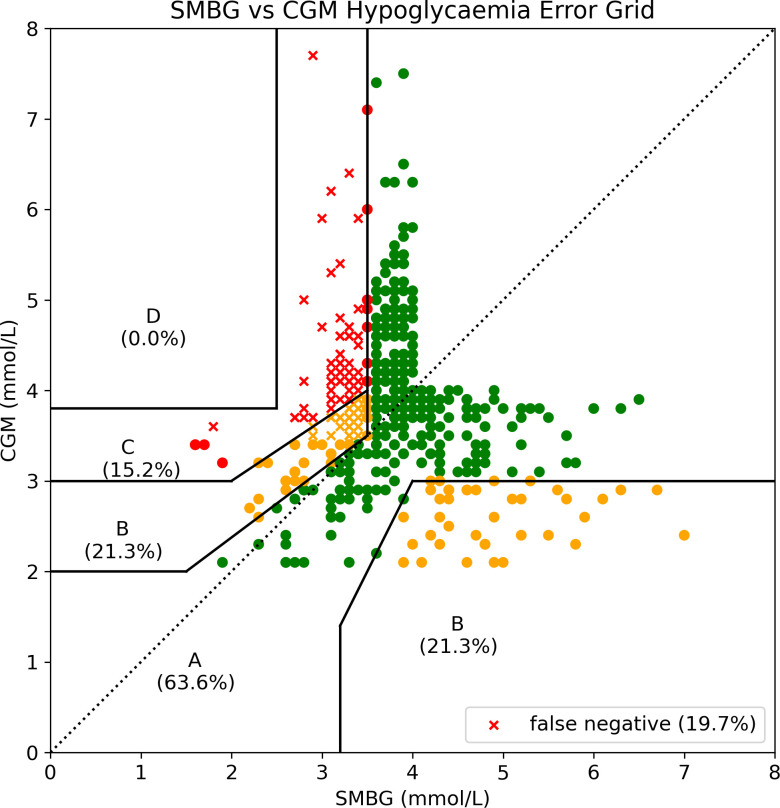
Figure 7.
Hypoglycaemia Error Grid plotted with paired values restricted to those in which at least one value was <4mmol/L. It is possible to immediately appreciate the increase in values categorised as slight to moderate risk when the dataset is restricted to that of interest to a patient living with CHI.

