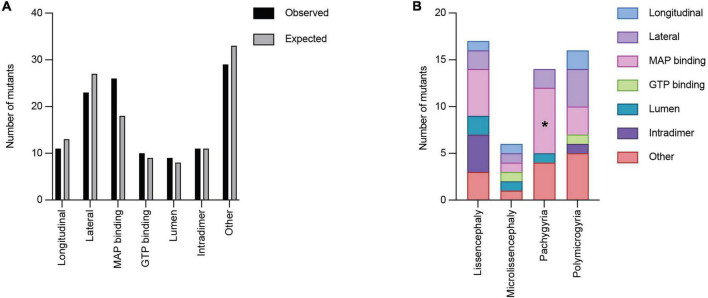
FIGURE 6.
Quantifying TUBA1A mutations by functional region. (A) TUBA1A mutations were sorted by the functional domains (longitudinal, lateral, MAP binding, GTP binding, lumen, intradimer, or other) in which they reside. Observed and expected number of mutations were compared using a Chi-squared test [12.59 critical value when α = 0.05; X2 (df = 6, N = 119) = 5.177; p = 0.5]2). The expected number of mutations in each functional domain was calculated by determining the percentage of amino acids that reside in each domain, then multiplying that by 119 (the number of TUBA1A missense mutations known to date). This value represents the number of mutations that would be expected to appear in each domain if all 119 mutations were randomly distributed. (B) TUBA1A mutations were sorted by the primary cortical malformation resulting from each mutation (lissencephaly, microlissencephaly, pachygyria, or polymicrogyria). For each cortical malformation, the number of mutations in each functional domain was reported. A Fisher’s exact test was run for each cortical malformation category to determine if mutations were enriched in one functional domain over the others. Asterisk (*) on bar indicates p-value < 0.05 (pachygyria MAP binding p < 0.01).

