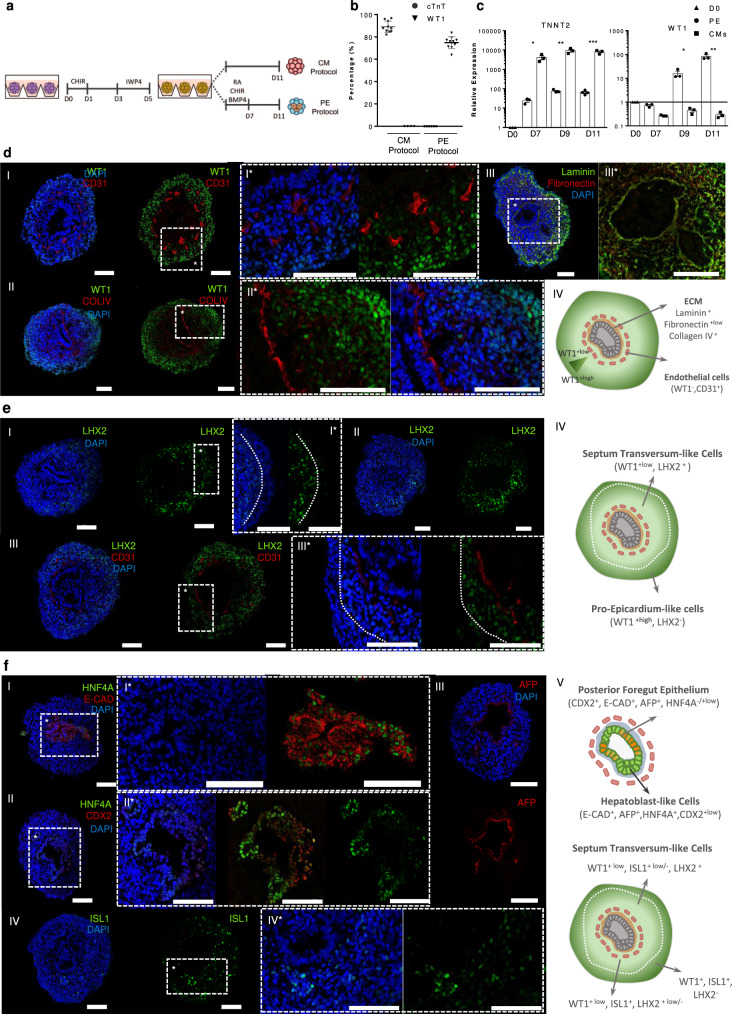
Fig. 1. PE/STM/PFH organoids recapitulate pro-epicardium, septum transversum, posterior foregut, and hepatic epithelium bud embryonic structure.
a Schematic protocol for PE cell differentiation from hPSC in comparison with the CM differentiation platform. b, Percentage of WT1 and cTnT positive cells after 11 days of differentiation for both PE and CM differentiation protocols. Data are represented as mean ± SEM of n = 10 independent experiments. c, Expression profile of TNNT2 and WT1 genes from D0 up to D11 of differentiation for PE and CM differentiation conditions. Values are normalized to GAPDH and to D0 of differentiation. Data are represented as mean ± SEM of n = 3 independent experiments. Exact p-values: TNNT2 D7 p = 0.0144, D9 p = 0.0043, D11 p = 0.0002; WT1 D7 p = 0.0023, D9 p = 0.0169, D11 p = 0.0040. *p < 0.05, ***p < 0.001, and ****p < 0.0001. d–f Representative IF staining of D11 PE/STM/PFH organoid sections, highlighting the WT1 positive cell population, and the presence of WT1- epithelium-like structures surrounded by CD31 endothelial-like cells and ECM proteins (d), the LHX2 cell population more pronounced near the epithelial structure and with lower expression levels near the aggregate edges (e), and the expression of the posterior endoderm gut marker CDX2, the hepatoblast markers HNF4A and AFP within the epithelial structure, and the ISL1 positive cell population (f). Scale bars, 100 µm.

