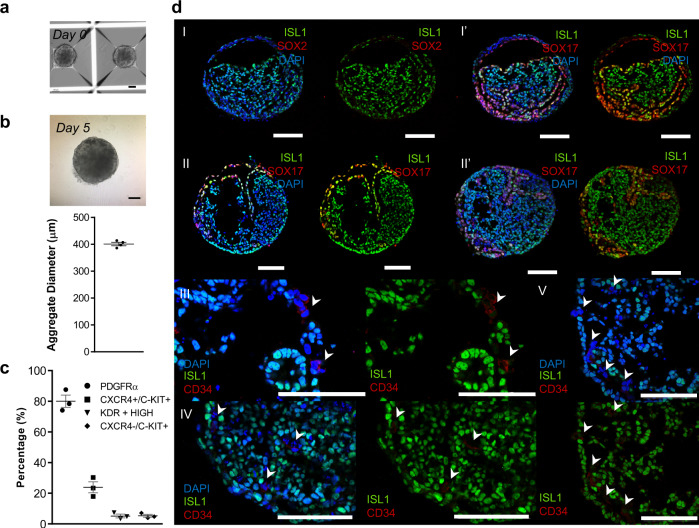
Fig. 2. Characterization of D5 hPSC-derived aggregates reveals a cell population that comprises endoderm and mesoderm progenitor cells.
a BF images of aggregates at D0 of differentiation. b BF images (top) and diameter distribution of aggregates at D5 of differentiation (µm) (bottom). Data are represented as mean ± SEM of n = 4 independent experiments. c Flow cytometry quantification of the percentage of DE progenitors (CXCR4+/c-KIT+), mesoderm progenitors (PDGFRα+) and vascular progenitor (KDRhigh and CXCR4−/c-KIT+) cells. Data are represented as mean ± SEM of n = 3 independent experiments. d Representative IF staining of D5 cardiac aggregate sections. Mesoderm, endoderm and vascular progenitors were stained for ISL1, SOX17, and CD34, respectively. Scale bars, 100 µm. White arrows represent CD34 positive cells. Source data are provided as a Source Data file.

