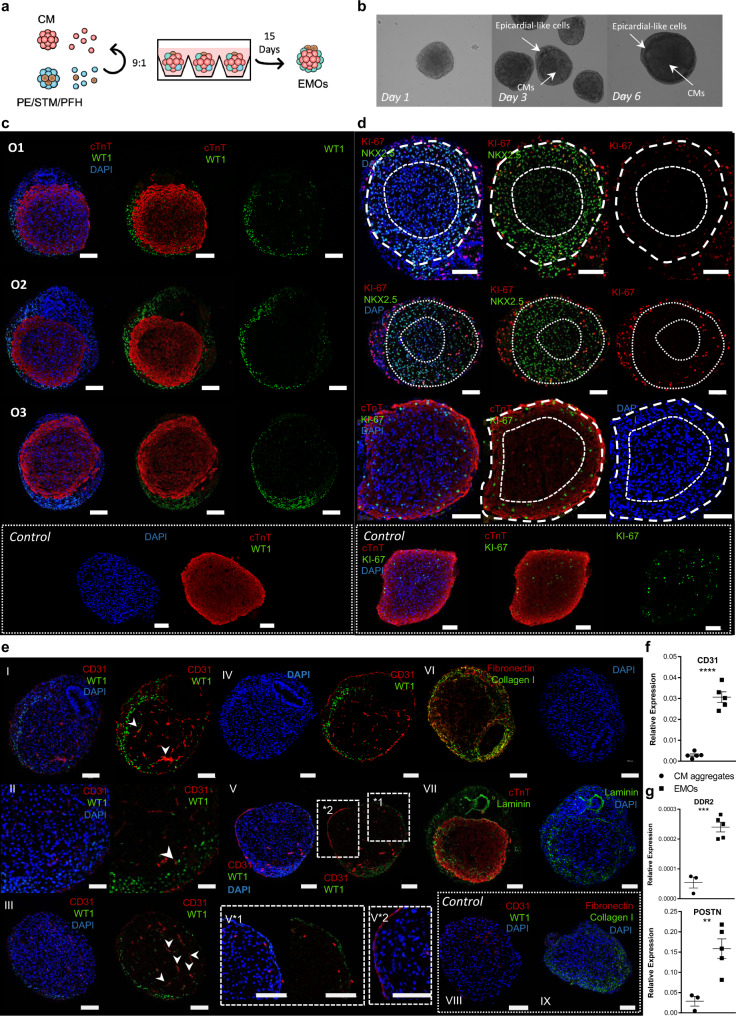
Fig. 4. Co-culture of PE/STM/PFH cells with CMs resulted in the development of a heart organoid that shows a self-organized epicardial-like layer surrounding a myocardium-like tissue.
a Schematic representation of EMOs generation. The ratio 9:1 corresponds to 9 CMs: 1 PE/STM/PFH cells. b, Representative BF images of EMOs at different time points of co-culture (day 1, day 3 and day 6), highlighting the epicardial-like cells and CMs within the EMOs. c–e Representative IF staining of EMOs sections after 15 days of co-culture, highlighting the epicardium- and myocardium-like layers (c), the difference between cTnT+/NKX2.5+ cells near the epicardium and the inner core of the organoid (d), and endothelial-like cells and ECM proteins present within the EMOs (e). IF staining of CM aggregates is also presented as control for the key mentioned markers. Scale bars, 100 µm. f, g Gene expression profile of CD31 (e), DDR2 and POSTN (f) in control CM aggregates and EMOs after 15 days of co-culture. Data are represented as mean ± SEM of n = 3 (CD31, POSTN, and DDR2 CM aggregate) and n = 5 (CD31, POSTN, and DDR2 EMOs) independent experiments. Exact p-values: CD31 p < 0.0001; DDR2 p = 0.003; POSTN p = 0.0082. Ox nomenclature identifies different organoids obtained from at least three independent experiments. **p < 0.01 ***p < 0.001 ****p < 0.0001.

