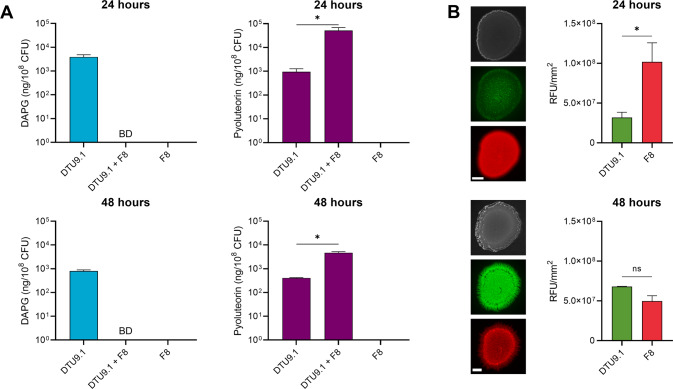
Fig. 1. P. protegens alters its secondary metabolism in coculture with P. capeferrum F8 on solid surface.
A Concentration of DAPG and pyoluteorin produced by P. protegens DTU9.1 after 24 and 48 h of growth on KBmalt agar. BD = Below detection (Student’s t-test: *p < 0.05). B Coculture dynamics of P. capeferrum F8 (red – mKate) and P. protegens DTU9.1 (green – gfp) on KBmalt. Top: Bright field image. Middle: gfp channel. Bottom mKate channel. Scale bar corresponds to 2 mm. Pictures are representative of three biological replicates with similar results. Fluorescence images were obtained with 500 ms exposure time. Relative fluorescence per colony for both channels was estimated with ImageJ.

