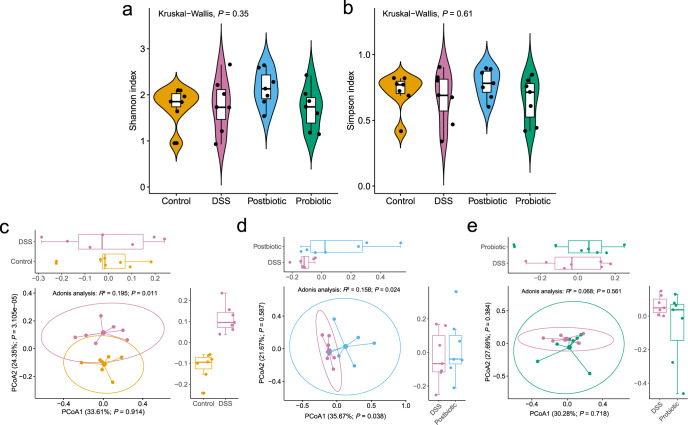
Fig. 2. Postbiotic but not probiotic regulated the gut microbiota diversity.
Shannon index (a) and Simpson index (b) of the fecal microbiota of the Control, Dextran sulfate sodium (DSS), Postbiotic, and Probiotic groups. Principal coordinate analysis (Bray–Curtis dissimilarity) score plot of species-level fecal microbiota of the Control and DSS groups (c), Postbiotic and DSS groups (d), and Probiotic and DSS groups (e). In the boxplot, horizontal line represents the median of the data, lower and upper bounds of the box represent the 25th and 75th percentile of data, and the whiskers represent the minimum and maximum of the data. The scattered point on the box represents the actual data points.

