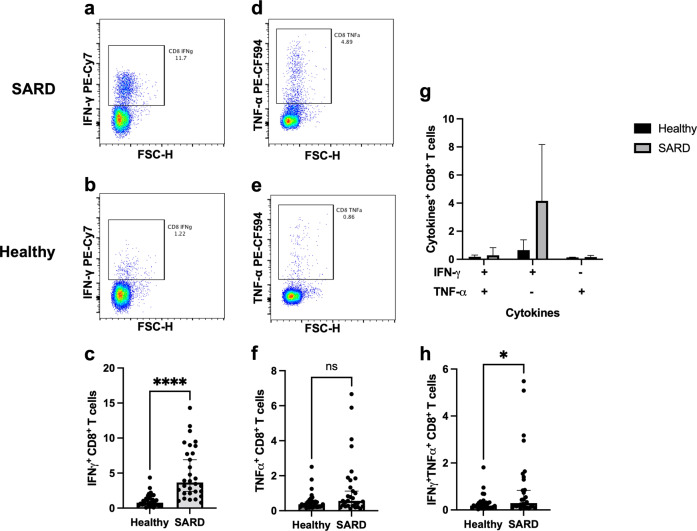
Fig. 5. Effector cytokine-producing CD8 + T cell responses in patients with systemic autoimmune rheumatic diseases and the healthy group.
Patients with SARDs and the healthy group were vaccinated with CoronaVac followed by ChAdOx1 nCoV-19 (Oxford-AstraZeneca). Four weeks post-vaccination, blood samples were obtained and processed to obtain PBMCs. Frozen PBMCs were thawed and stimulated with S1 peptide pools. The blood samples were processed to obtain PBMCs. The cells were stained for surface T cell phenotypes and intracellular effector cytokines. Representative flow plots of IFN-γ producing CD8 + T cells in (a) patients with SARDs and (b) the healthy group (c) Percentage of IFN-γ producing CD8 + T cell responses. Representative flow plots of TNF-α producing CD8 + T cells in (d) patients with SARDs and (e) the healthy group (f) Percentage of TNF-α producing CD8 + T cell responses. (g and h) Percentages of IFN-γ and/or TNF-α secreting CD8 + T cells. Each symbol represents one participant and data are presented as the median with 95% CI. Statistical significance was determined using Mann–Whitney test between groups. * p ≤ 0.05, ****p ≤ 0.0001, ns nonsignificant.

